With candidate filing for the 2026 election starting on Dec. 1, it’s a good time to take stock of the electoral landscape in North Carolina. With that in mind, here is the 2026 Civitas Partisan Index (CPI). The CPI measures the general tendency of voters in a district to vote for one of the two major parties.
Based on each district’s CPI score (see below for our methodology), we rate it as either a toss-up or leaning, likely, or safe for a particular party. We rate districts with a CPI of 0–1 percentage points in either direction as toss-ups, 2–5 as lean, 6–9 as likely, and 10 or more as safe seats for the respective parties. Districts with a 0 rating have a partisan lean of less than 0.5 percentage points.
While it is almost impossible for a party to lose a safe seat, it can lose a likely district under certain circumstances, such as the presence of an especially strong candidate, an incumbent’s scandal, or the result of a wave election. For example, a Democrat won in a likely Republican district in 2018, and Republicans won in likely Democratic districts in 2022 and 2024.
Lean districts can flip with some regularity, especially in midterm elections. For example, in the 2022 Biden midterm, Republicans picked up wins in eight lean-Democratic districts. On the other hand, in the last Trump midterm in 2018, Democrats won in seven lean-Republican districts (but a Republican also managed to win in one lean-Democratic district).
As the term implies, toss-up districts are too close to assign a reliable partisan lean.
The partisan leanings of North Carolina Senate districts
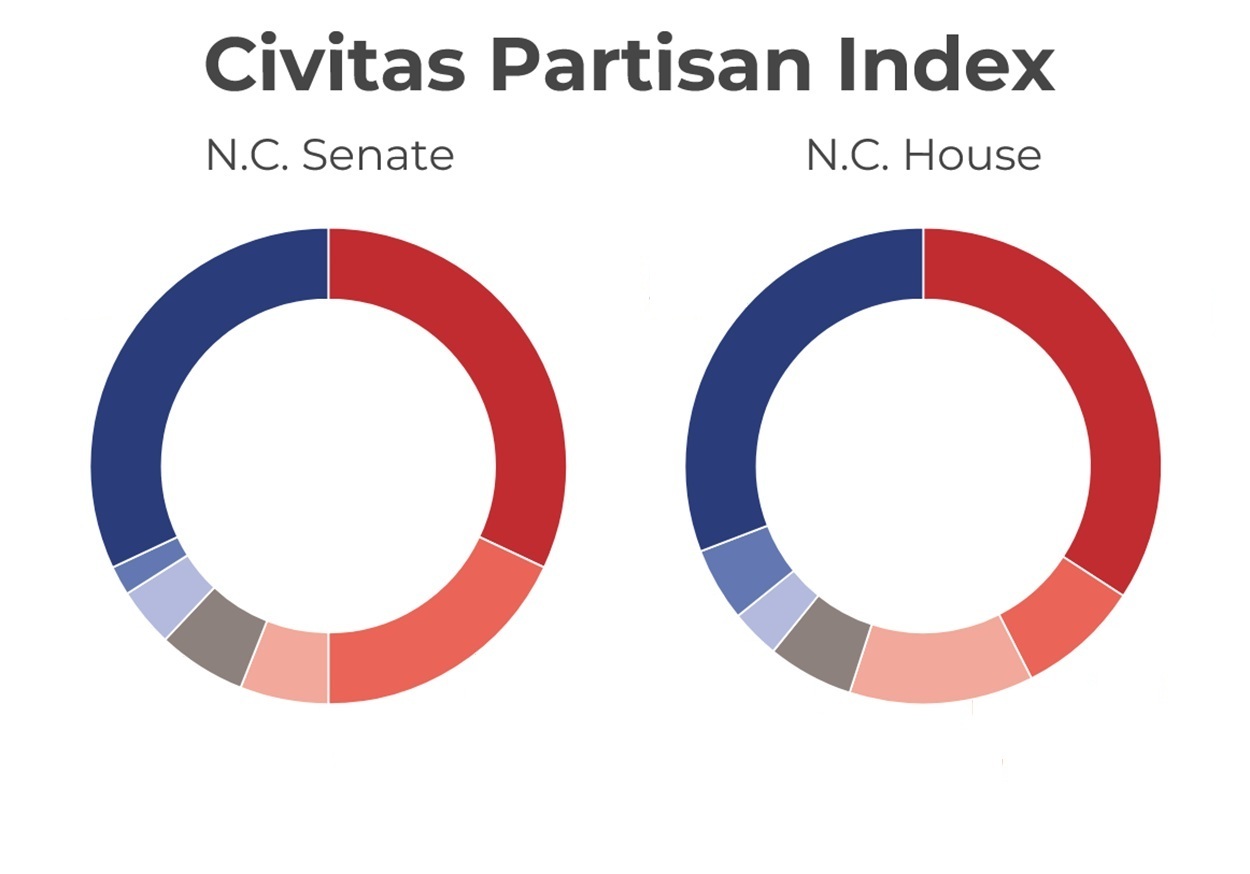
There are 50 seats in the North Carolina Senate. The CPI indicates that there are 16 safe Democratic seats, one likely Democratic seat, two lean Democratic seats, three toss-up seats, three lean Republican seats, nine likely Republican seats, and 16 safe Republican seats in the state Senate. See the map below for details.
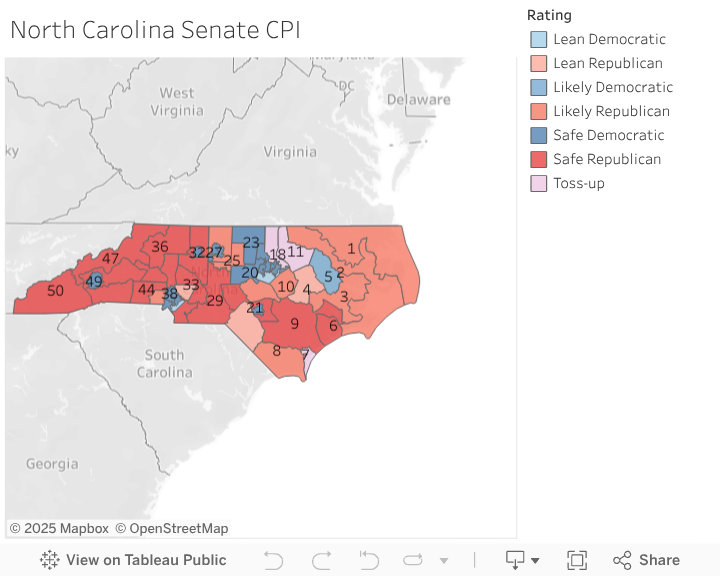
Republicans start with 25 likely or safe seats in the Senate. They need to pick up only one of the six lean Republican and toss-up seats to retain their majority. To get a super majority (the 30 votes needed to override a veto), Republicans need to pick up all of the lean Republican seats and two of the three toss-up seats.
For Democrats to gain a majority, they would need to sweep all the toss-up seats and lean Republican districts, plus win in one likely Republican district. Since 2026 is a midterm election with a Republican in the White House, that goal is unlikely, but not impossible.
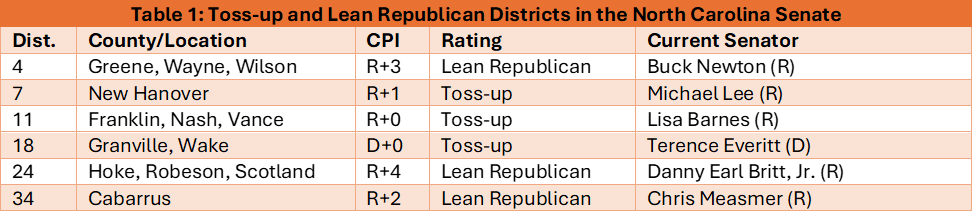
Table 1 shows the Senate districts most likely to be competitive. Since 2026 is a Republican midterm election, that list includes toss-up and lean Republican districts. (We similarly listed toss-up and lean Democratic districts as the most likely to be competitive in the 2022 midterm, when a Democrat was president.)
Click on the file below to see a full list of CPI ratings for all North Carolina Senate districts.
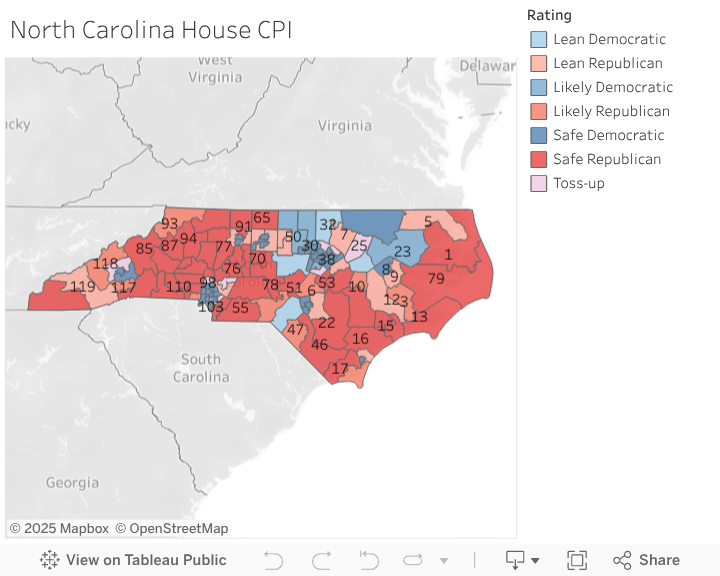
The partisan leanings of North Carolina House districts
There are 120 seats in the North Carolina House. The CPI indicates that there are 37 safe Democratic seats, six likely Democratic seats, four lean Democratic seats, seven toss-up seats, 15 lean Republican seats, 10 likely Republican seats, and 41 safe Republican seats in the state House.
To retain their House majority, Republicans need to win all the safe and likely Republican districts, plus 10 of the 15 lean Republican districts.
The Democrats’ road to a House majority is difficult, but easier than achieving a majority in the Senate. They must win all of their safe, likely, and lean districts, as well as the seven toss-up districts, and seven of the 15 lean Republican districts.
Table 2 shows the House districts most likely to be competitive. Again, that list includes toss-up and lean Republican districts.

Click on the file below to see a full list of CPI ratings for all North Carolina House districts.
How we measure the political leanings of North Carolina legislative districts
We model the CPI after the Cook Political Report’s Partisan Voting Index. The CPI is a measure of the base partisan leanings of a North Carolina state legislative district compared to the state as a whole. For each district, the CPI score lists the party (identified by initials, D or R) the district tends to favor, followed by a number indicating the relative lean of the district toward that party. For example, a district that tends to vote about 7 percentage points more Democratic than the state average would have a CPI score of D+7.
The 2026 CPI utilizes precinct-level results from nine 2024 Council of State races, as reported by the North Carolina State Board of Elections (NCSBE) precinct sort files. The Republican votes in those races were added together in each state legislative district and divided by the total two-party votes for those nine races to determine the Republican percentage in each district. That percentage is then subtracted from the Republican statewide average for those nine races (50.83 percent), and rounded up to the nearest whole number, to find the CPI rating for each district.
For example, if a district has an average Republican vote of 48.54 percent, it will have a CPI of D+2 (48.54 – 50.83 = -2.29, rounded to -2) and be rated lean Democratic. That means the district is about two percentage points more Democratic in terms of two-party vote share than is the state as a whole.
The 2024 Council of State races used in the CPI were for lieutenant governor, commissioner of agriculture, commissioner of insurance, commissioner of labor, attorney general, secretary of state, superintendent of public instruction, state treasurer, and state auditor.
The governor’s race was excluded because it was an outlier from the norm of the range of outcomes in statewide elections and could have affected the ratings of some districts to that the rating does not reflect their true partisan leanings. The effect of including it would have been countered in most districts by the norming effect of considering each district’s deviation from the statewide average, however. The governor’s race was included in the CPI in 2020, 2022, and 2024 but excluded from earlier versions.
How to Use the CPI
The CPI by itself is not a tool for predicting races, since it does not include measures such as incumbency, funds raised, or other indicators of candidate quality. Even so, someone using the CPI alone would have successfully predicted the outcome in 98.8 percent of the races assigned a partisan lean in 2024.
There are two ways the CPI may differ from other indexes. First, other indexes may base their scores on a composite of different races (such as president or United States senator, for example). Second, other indexes might not base their ratings on a comparison to the average statewide vote, but instead compare the two-party vote totals when rating a district. Those differences in methodology can yield results that appear to be quite different. For example, the CPI scores the 1st North Carolina Senate District as R+6, whereas someone using the Dave’s Redistricting app might score it R+9. Both ratings are legitimate and indicate a district that would usually vote Republican but could be competitive in some circumstances.
The CPI is a baseline measure that journalists, researchers, and others can use when examining North Carolina legislative races. Utilizing the CPI can provide you with valuable insights into the 2026 election.