
For the first time in several years, North Carolina will use all the same state legislative districts for two elections in a row. That, coupled with the release of the 2026 Civitas Partisan Index (CPI) on November 6, allows us to assess the political shifts in North Carolina General Assembly districts by comparing the 2026 CPI with the 2024 CPI.
Most of the shifts are continuations of past trends. Republicans continue to gain ground in the East, the Sandhills, and the southern Piedmont, while Democrats make inroads in suburban areas surrounding the state’s large metropolitan areas.
One change is in western North Carolina. The region (outside of Asheville) had been trending Republican, but much of it shifted towards the Democrats in the latest CPI
Shifts in Senate districts
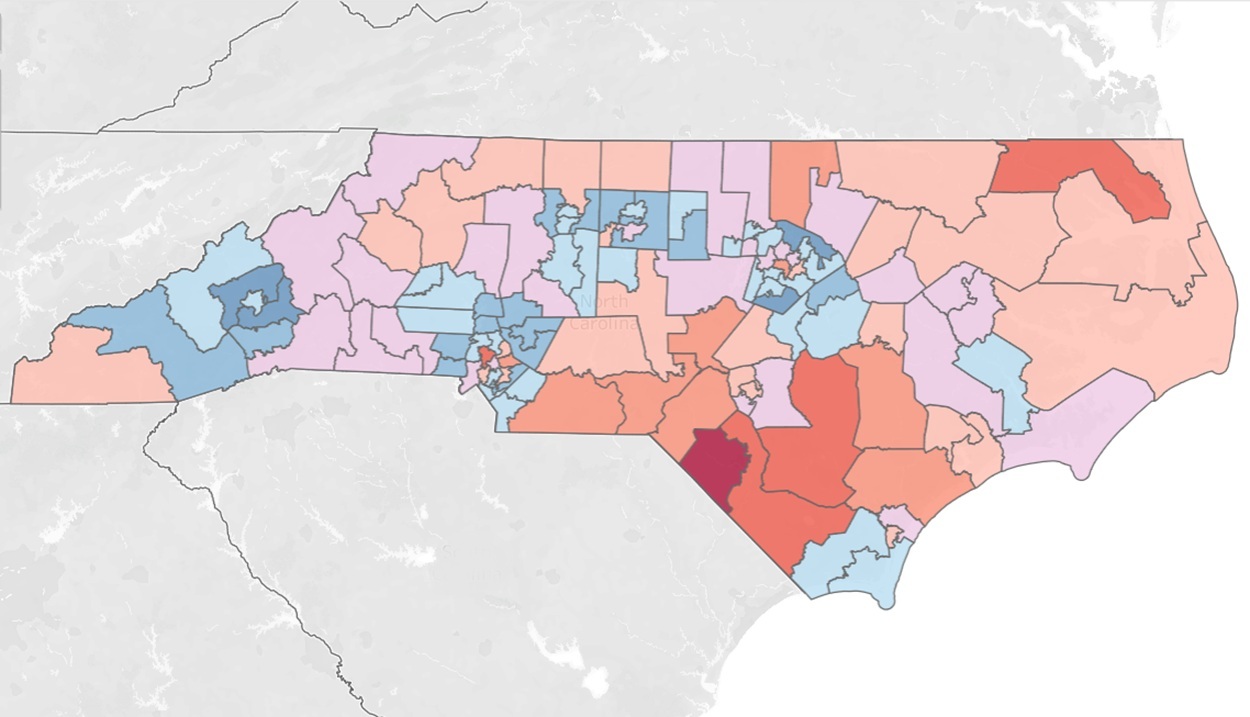
Below is an interactive map showing how all 50 North Carolina Senate districts have shifted from the 2024 to the 2026 CPIs.
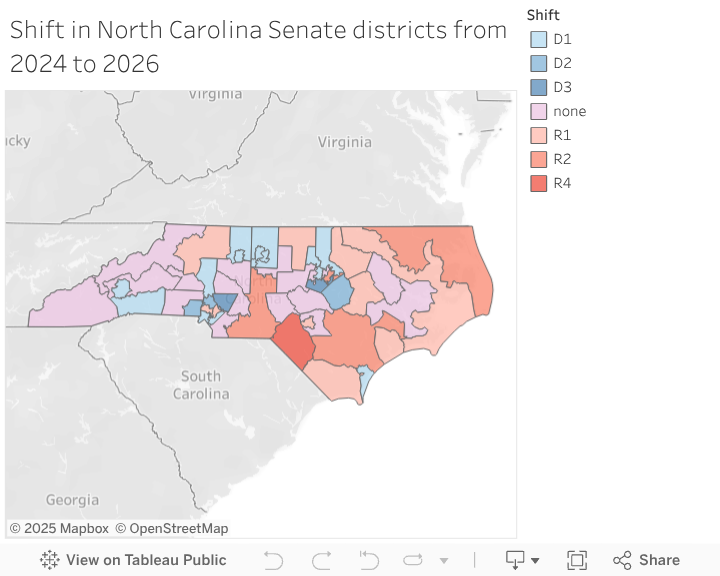
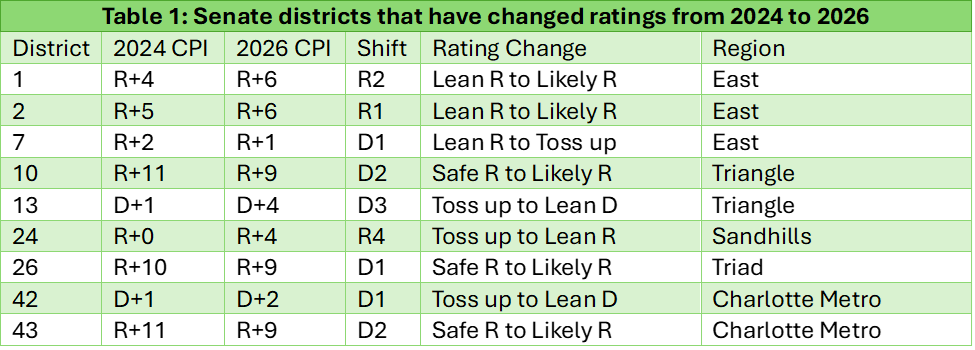
Table 1 shows which Senate districts have changed ratings (for example, the 7th District in New Hanover County changes from “Lean R” to “Toss-up”). Some districts changed by two or three percentage points, but did move to a different rating from 2024.
Shifts in House districts
Below is an interactive map showing how all 120 North Carolina House districts have shifted from the 2024 to the 2026 CPIs.
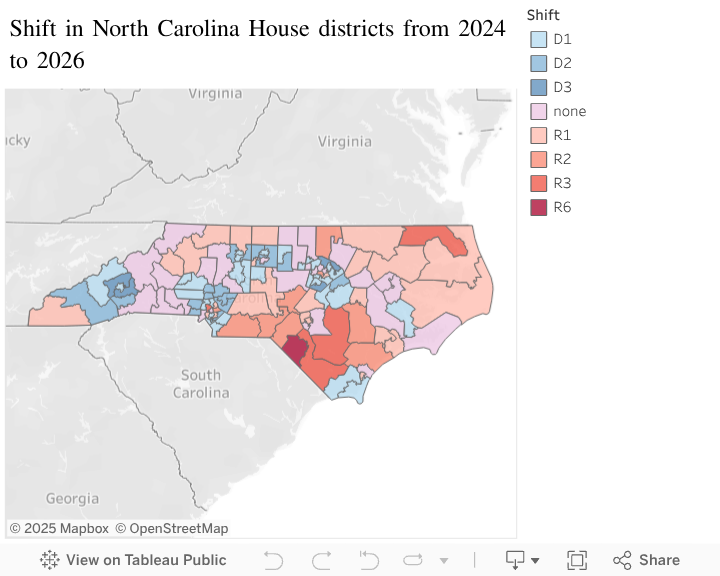
Table 2 shows which House districts have changed ratings. Again, some districts changed by two or three percentage points, but did move to a different rating from 2024. While both parties have made gains, the shifts in favor of Democrats have been more efficiently distributed. For example, four districts have shifted from Lean R to Toss-up, while only one district has changed from Lean D to Toss-up. Both of the districts that have changed from Toss-up have shifted towards Republicans, however.

Based on each district’s CPI score (see below for our methodology), we rate it as either a toss-up or leaning, likely, or safe for a particular party. We rate districts with a CPI of 0–1 percentage points in either direction as toss-ups, 2–5 as lean, 6–9 as likely, and 10 or more as safe seats for the respective parties. Districts with a 0 rating have a partisan lean of less than 0.5 percentage points.