

As the debate in North Carolina over how best to address property tax reform unfolds, levy limits are likely to take center stage as a viable policy option.
Levy limits restrict the annual growth of total property tax collections within a jurisdiction, typically by lowering the property tax rate as property values increase. But not all levy limits are the same. In particular, they can differ in how they treat new construction, a design choice that affects tax rates, revenue growth, and the distribution of the tax burden.
Using a framework developed by tax policy analyst Jared Walczak, this article examines three levy limit designs — we’ll call them the Boise, Brownsville, and Boston models. It then turns to the question on many taxpayers’ minds: Do levy limits actually guarantee that my property tax bill will not increase more than the stated cap?
Three approaches to levy limits
Although all levy limits cap the growth of total property tax collections, they differ in how they treat new construction. That design choice determines how tax rates are rolled back, or reduced, and how property tax growth is allocated between existing property owners and new construction. In practice, levy limits operate by rolling back tax rates when assessed values rise, ensuring collections do not exceed the allowable cap.
- In the Boise model, new construction is included in the levy limit, meaning revenue collected from both existing and new property must fall within the new cap.
- In the Brownsville model, new construction is excluded from the levy limit, meaning that only existing property must fall within the new cap.
- In the Boston model, new construction is added to the levy limit itself, thereby directly increasing the new cap.
Levy limits by example
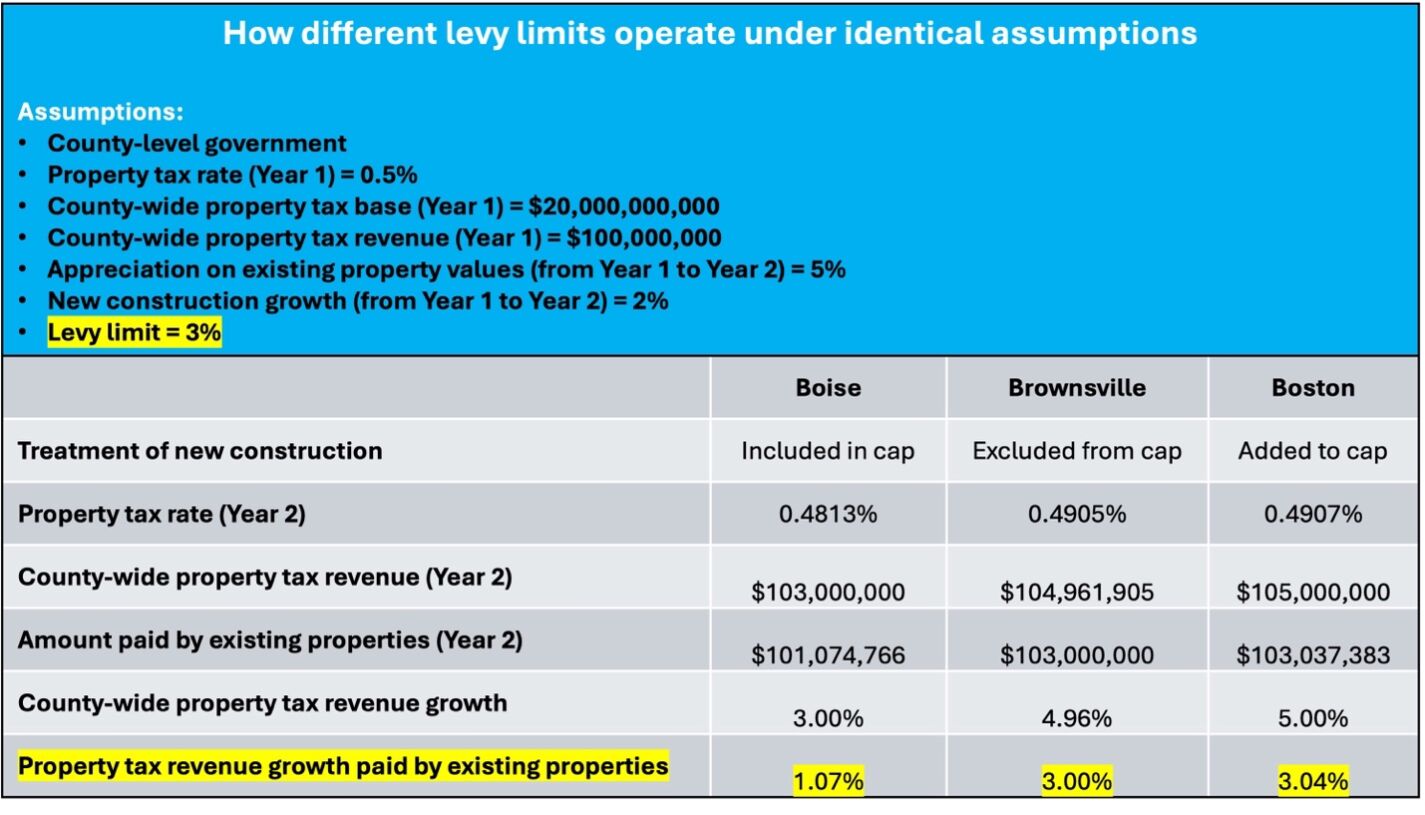
To illustrate how these three levy limit designs operate in practice, consider a simplified county-wide example using identical assumptions provided in the chart below, including a 3 percent levy limit. This cap would limit the growth in total property tax collections to 3 percent over the previous year.
Under the Boise model, where new construction is included in the cap, the required rate rollback is the largest. Because both existing and new property must fit within the same overall limit, growth from new construction reduces the revenue that can be collected from existing property. As a result, taxes paid by existing property owners grow less than the stated levy limit would suggest, increasing by only 1.07 percent.
The Brownsville model produces a different result. Because the cap applies only to existing property, the rollback rate is calculated to hold growth in existing property taxes exactly at the levy limit. That rate is then applied to new construction, allowing total collections to grow with development while keeping the burden on existing property owners aligned with the actual cap.
Under the Boston model, new construction expands the cap itself. Allowable revenue growth includes both the capped increase on existing property and the taxes generated by new construction at the prior year’s rate. While this structure accommodates revenue growth, it also allows collections from existing property to increase by 3.04 percent, modestly exceeding the stated levy limit.
What about my tax bill?
At this point, it might be reasonable to conclude that a well-designed levy limit should prevent large property tax increases for all residents. After all, if total collections are capped and tax rates are rolled back, it seems intuitive that individual tax bills should be constrained as well.
However, levy limits operate at the aggregate level, not the parcel level. While they determine how much total collections may grow, they do not control how that growth is distributed across individual properties.
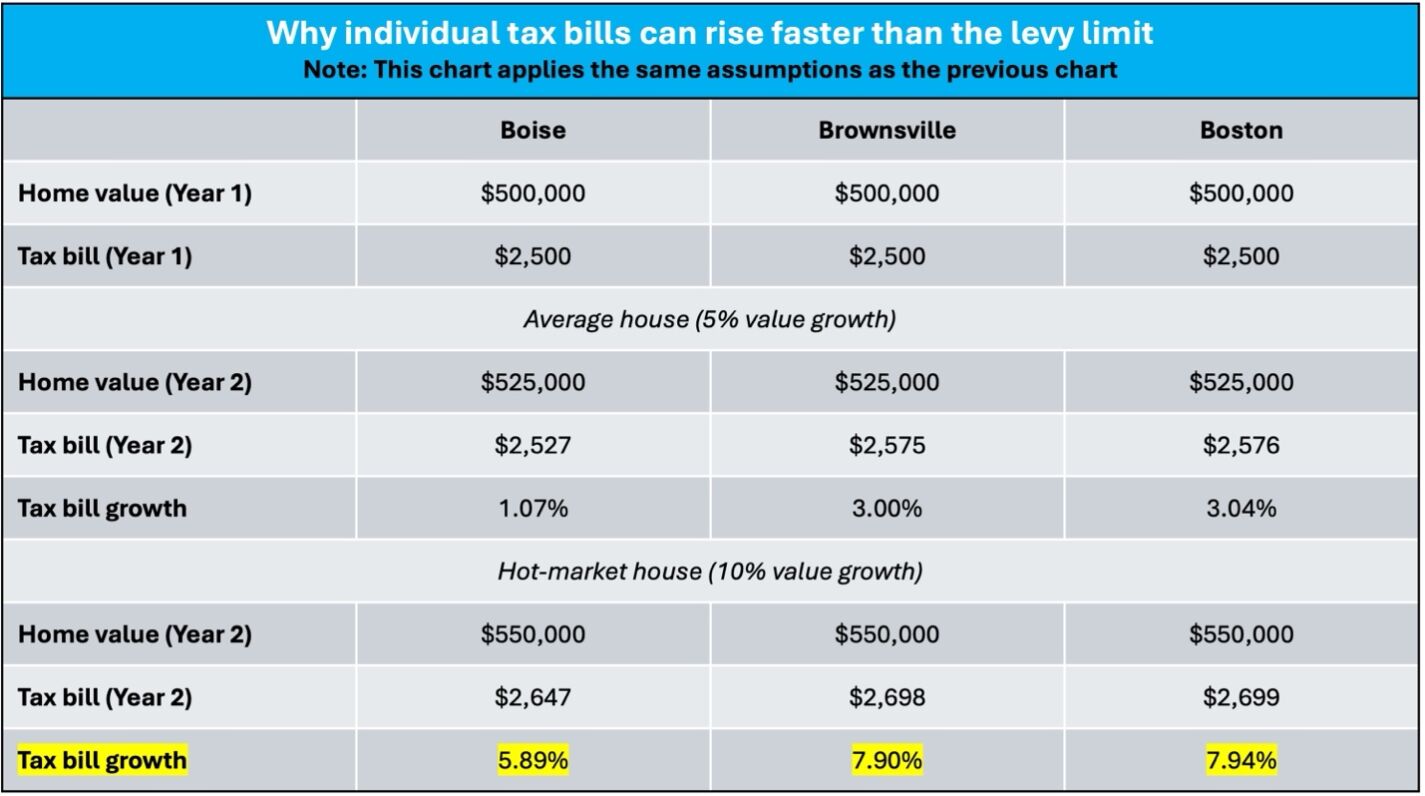
For a person whose home value increases at the same rate as the county-wide average of 5 percent, the levy limit behaves as expected. Their tax bill rises in line with the county-wide cap. However, for a hot-market homeowner who experiences a 10 percent increase in value, the result is very different. Due to the home’s assessed value increasing more than the average, growth in their tax bill exceeds the county-wide cap.
Under the Boise, Brownsville, and Boston models, the homeowner in the hot market would experience a property tax bill hike of 5.89 percent, 7.90 percent, or 7.94 percent, respectively (applying the new home value times the new property tax rate taken from year 2 in the table above). The takeaway is straightforward: regardless of design, a levy limit is not a guarantee that an individual tax bill won’t increase more than the cap.
Other considerations in levy limit design
Beyond the treatment of new construction, several additional design choices are also worth noting.
- When levy limits rely solely on a fixed growth cap, collections can be increased to the maximum allowed level even after periods of weak or declining property values. Tying allowable growth to the lesser of a fixed cap or inflation can prevent automatic revenue increases to the allowable limit.
- Levy limits often include exclusions for certain spending categories, such as debt service or capital projects. While sometimes justified, broad exclusions can substantially weaken the effectiveness of a levy limit.
- Levy limits implicitly assume regular reappraisals. To effectively implement any levy limit design, revaluations would likely be required annually.
Finally, levy limits constrain aggregate collections, not individual tax bills. If policymakers want to limit how much each individual property tax bill can increase, they must pair a levy limit with an assessment limit, which caps the growth rate of each property’s taxable value.
Closing thoughts
Levy limits can play an important role in restraining property tax growth, but they are not uniform. Design choices — particularly how new construction is treated — shape tax rates, revenue growth, and the distribution of the tax burden.
Among the three levy limit designs, the Brownsville model, which excludes new construction from the levy cap and rollback calculation, offers the most transparent and accurate constraint on tax growth.
The models underlying the examples and charts in this article are available here.