
“The ACFR Net Position data leaves no doubt that the state government is bigger, financially, than ever before. That government growth is real, and much larger than .7% budget growth the Biennial Comparison report of cash flow depicts.”
The following has been adapted from an excerpt of the Frontier Weekly Newsletter written by Kendall Cotton for the April 16th edition.
Last week the Legislative Audit Committee heard a report on findings from the newly released FY 2025 Annual Comprehensive Financial Report (ACFR) for the State of Montana. This is a long and super technical report that LAD Director Angus McGiver calls “the most important document in state government that no one knows about”.
It’s true. Amidst the 300+ pages of the FY 2025 ACFR is a wealth of info about the state’s finances. What makes the ACFR different from typical legislative budget reports is that the ACFR utilizes accrual accounting methods to assess the state’s financial position. In a sense, they answer different questions.
Legislative reports like the Biennial Comparison use budgetary accounting to answer “How much did government appropriations grow?” Think of the Biennial Comparison as the state’s cash flow statement that documents revenues coming in and appropriations flowing out.
The ACFR, and specifically the ACFR’s “Financial Net Position” metric, answers: “How much taxpayer money is the government using?” Think of the ACFR’s Net Position analysis as the state’s balance sheet, documenting assets and liabilities the state has accumulated.
So how much taxpayer money is the government using in 2025, according to the ACFR? We compiled this graph to illustrate:
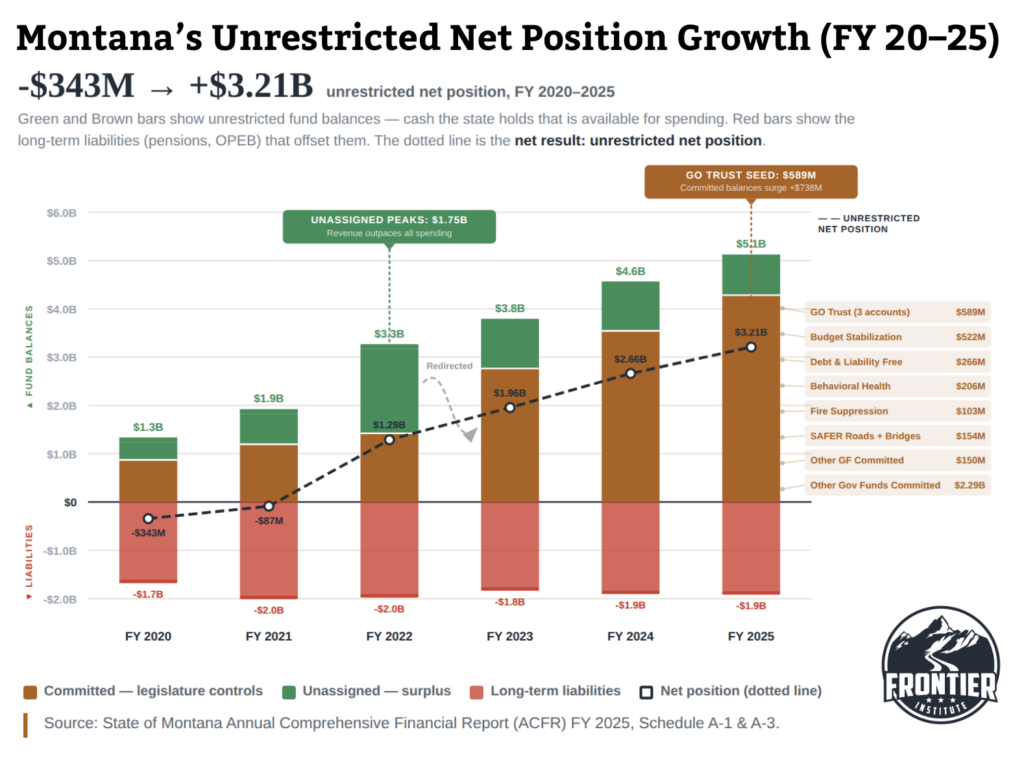
As you can see, the state has accumulated billions more taxpayer resources on its balance sheet over the last 5 years. Committed fund balances grew 392% from FY 20-25, from $870M to $4.28B. The FY2025 surge includes $589M in new GO Trust accounts alone. That’s $3.41 Billion in additional taxpayer money that was collected, but not “spent”, and not returned.
No, it’s not federal COVID money that is inflating the balance sheet here. Federal $’s either get spent and move off the balance sheet, or they remain in restricted funds not reflected in the green and brown bars on this chart.
The ACFR data paints a stark picture of government growth. The state has redirected large portions of surplus to committed accounts dedicated to serving government interests, rather than sending it back to taxpayers. The state government’s financial footprint, the amount of taxpayer money it has taken and kept for its own use, has grown immensely.
This data highlights the accumulation pattern I wrote about a few weeks ago, where the state over-collects from taxpayers and then siphons off the surplus into committed government accounts instead of returning it.
The ACFR Net Position data leaves no doubt that the state government is bigger, financially, than ever before. That government growth is real, and much larger than .7% budget growth the Biennial Comparison report of cash flow depicts.
The question for taxpayers is whether this balance sheet accumulation is appropriate or excessive. We need to ask:
Does the state government really need $4 billion+ held in savings accounts for future uses? What evidence is there to justify this rate of accumulation?
Instead of locking money in savings accounts and using a small trickle of future earnings to fix bridges and infrastructure, stabilize the pension system etc., why shouldn’t the money be directly appropriated to fix a large part of those problems now? Are long-term savings and trusts really the right vehicle to address these problems?
Would the money currently held by the state be better spent and invested by taxpayers? Should we reduce tax rates to address future over-collection?
To truly answer these questions, both the state’s cash flow and balance sheet must be considered together, not in isolation.
For advocates for limiting the size and scope of state government, the ACFR report could be your best weapon. Read it, utilize it.