While most North Carolina General Assembly districts trend Republican, this looks like a good year for Democrats. They enjoy a 48-42.6 percent advantage over Republicans on the state legislative generic ballot, according to the August Carolina Journal poll. That means some Republican-leaning districts could go their way.
Districts, however, vary in their tendency to shift support between the parties. So it is worth investigating the extent to which voters in individual districts vary in their support for the two major parties, and how that variation coincides with the competitiveness of those districts. That information could give us more information about which districts are likely to be close in November.
Picking the baseline
To find that, I compared the swing in each of North Carolina’s 170 state legislative districts between the 2024 races for Attorney General (51.43% Democratic) and for Commissioner of Labor (47.25% Democratic). Those were the second-most Democratic and second-most Republican Council of State races, respectively. The swing between those races was 4.2 percentage points.
Why not consider the most extreme outcomes? The race for governor between Josh Stein and Mark Robinson was an obvious outlier from the North Carolina norm of competitive statewide races, primarily due to Robinson being a generationally bad candidate. While the result in the Commissioner of Agriculture race was not as extreme, Democrats have apparently written off winning that seat, making it more difficult to recruit first-tier candidates and widening the gap beyond what it otherwise would be. The result is a list of reasonable variations within each district rather than a more extreme variation that can only be expected rarely.
The Attorney General and Commissioner of Labor races also had no third-party candidates, making for a cleaner comparison.
Which Senate districts were more “swingy?”
Using a methodology similar to that of the Civitas Partisan Index, I assigned precinct-level results to each district. Results from split precincts were allocated proportionally between districts based on the distribution of census blocks between them. That small imprecision is unavoidable since results cannot be distributed below the precinct level, and will have little impact on the final results.
The volatility in the 50 Senate districts ranged from 0.85 percent in District 24 (Hoke, Robinson, and Scotland counties) to 8.51 percent in District 42 (Mecklenburg County). I rated the fifteen districts with the highest volatility (the gap between the Attorney General and Commissioner of Labor races) “high” and the fifteen with the lowest volatility “low.”
The chart also lists the Civitas Partisan Index (CPI) rating for the district. The CPI “measures the general tendency of voters in a district to vote for one of the two major parties.” Districts could have high volatility and still not be competitive if the gap in support between the two parties is too wide.
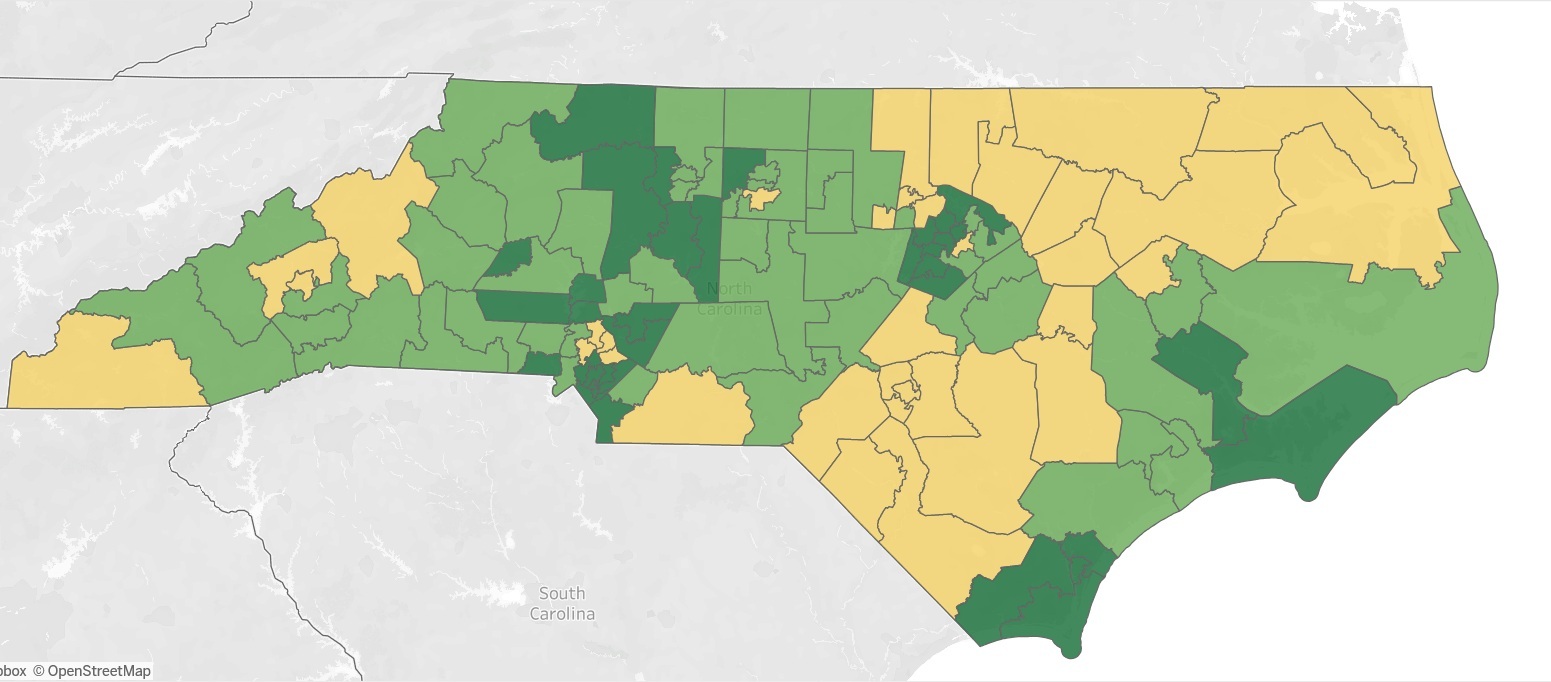
As seen in the map below, most high-volatility districts (dark green) are clustered in urban and inner-suburban areas. The two prominent exceptions, District 14 in Wake County and District 40 in Mecklenburg, both have the highest minority populations in their respective counties.

How about the House?
The volatility in the House districts ranged from negative 0.09 percent in District 47 (the only district where the Democratic candidate for Commissioner of Labor outperformed the Democratic candidate for Attorney General) in Cumberland County to 10.89 percent in District 104 in Mecklenburg County. The latter district is at the tip of the former “Republican wedge” in central Charlotte, where Republicans used to regularly win a majority of votes.
The 35 districts with the smallest volatility are marked “low,” those with the largest volatility are marked “high,” and the remaining 50 districts are marked “mid.”
The House map also shows a concentration of high-volatility districts in urban and suburban areas, especially in and around Wake and Mecklenburg counties. However, there is also a cluster of low-volatility districts in northern Mecklenburg. What really jumps out on the House map, however, is the large band of low-volatility districts across the Coastal Plain and Sandhills from the South Carolina to the Virginia lines.

Conclusion and a caveat
The data presented here show the areas with more persuadable voters and those where it would take a lot to get many voters to split their tickets. When combined with the Civitas Partisan Index, it gives us an idea of where we could find competitive races and where races in apparently close districts may be foregone conclusions.
For example, Senate District 24, in southeastern North Carolina, is rated R+4 and theoretically could be competitive this fall. The volatility in the district is only 0.85 percent, however, meaning that even a strong Democratic candidate would have a narrow path to victory.
The analysis presented here is only a snapshot of two races. The particularities of the races used may have impacted the results somewhat. That is especially true in Mecklenburg County, from which both Democratic candidates in the races analyzed (Jeff Jackson and Braxton Winston II) hail.
In an ideal world, you would include all eight of the Council of State Races other than the governor and commissioner of agriculture, and use the widest variance in each precinct. However, getting and confirming that data would be too time-consuming. That said, the data here is useful for analysis.