This month’s release of 2024-25 math and reading test results from the Education Department reopened a nagging question:
Why are New York’s public school students showing steadily higher proficiency levels on state-administered tests when their scores on federal tests have been getting worse?
Part of the answer seems to lie in the Education Department’s grading methods. Over the past dozen years, the department has been gradually lowering “cut scores” – the minimum number of questions students have to answer correctly in order to be considered proficient at each grade level.
Officials have said these changes were necessary to adjust for the varying difficulty of test questions from year to year. In any given year the state raises some cut scores, lowers others and leaves some unchanged.
However, a review of state records over the past dozen years shows a clear trend: Since adopting the Common Core Learning Standards in 2013, downward changes to cut scores have outweighed the upward ones for all 12 of the math and reading tests administered in grades 3 through 8.
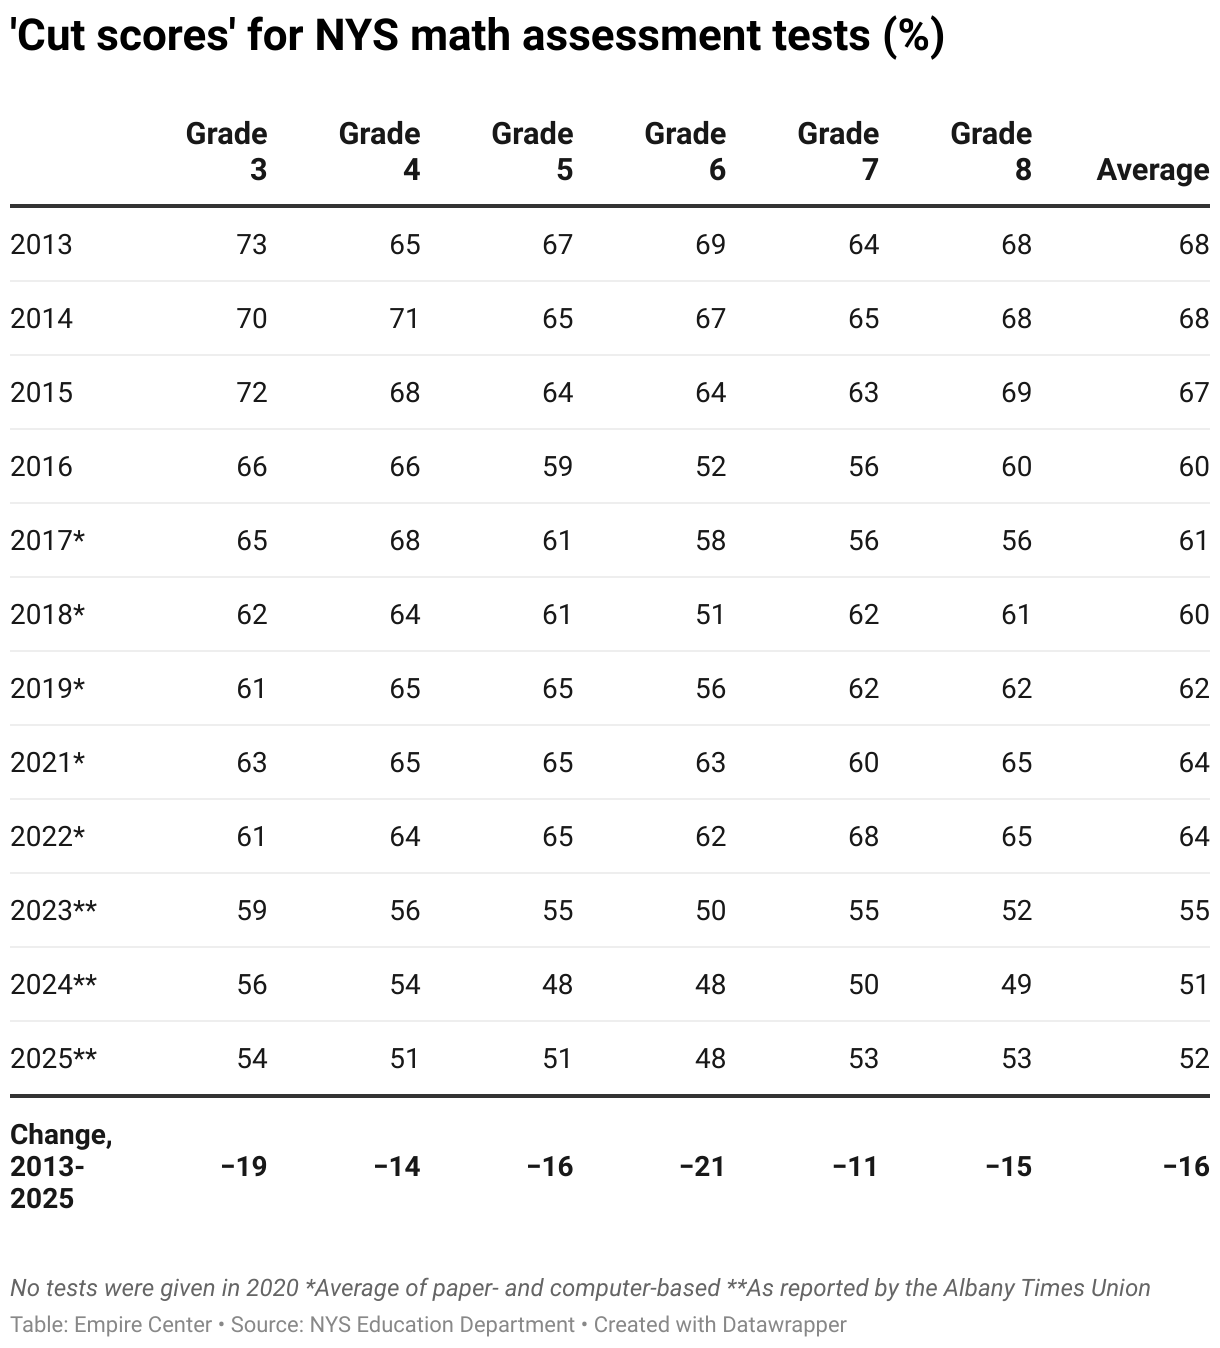
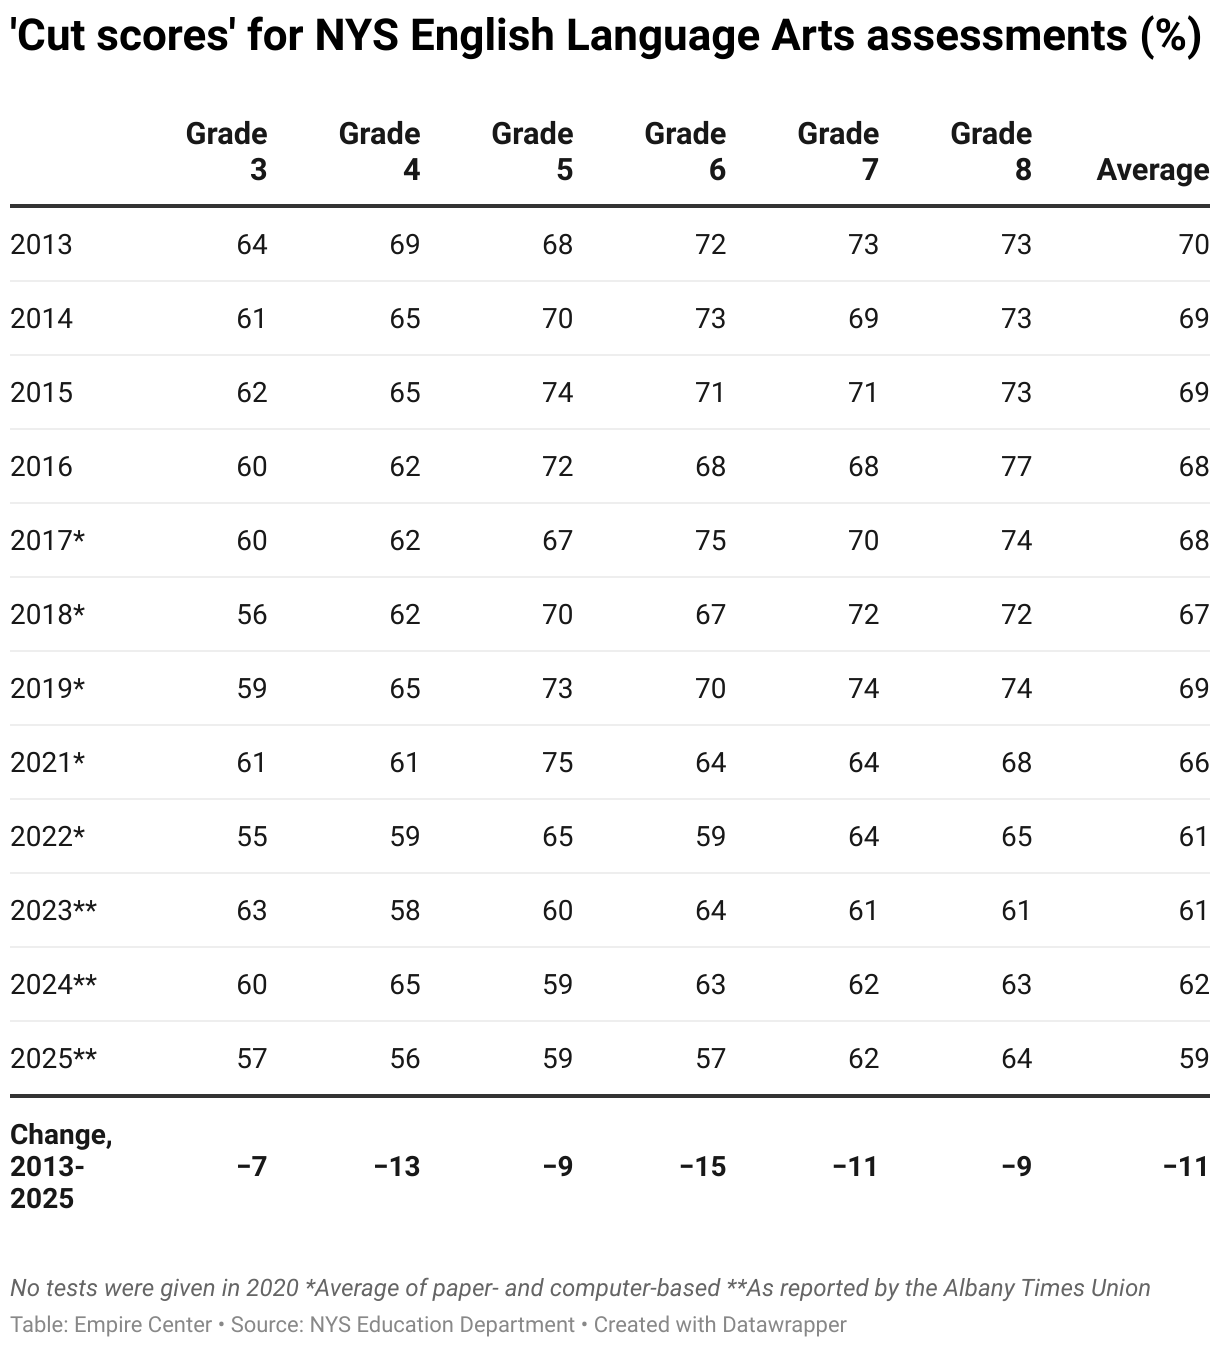
The average cut score for the math tests has dropped 16 points, from 68 percent in 2013 to 52 percent in 2025. The average cut score for the reading tests (known as English Language Arts) is down 11 points, from 70 percent to 59 percent. (See tables below.)
During those same years, state-reported proficiency levels were generally rising – up by an average of 22 points in reading and 24 points in math.
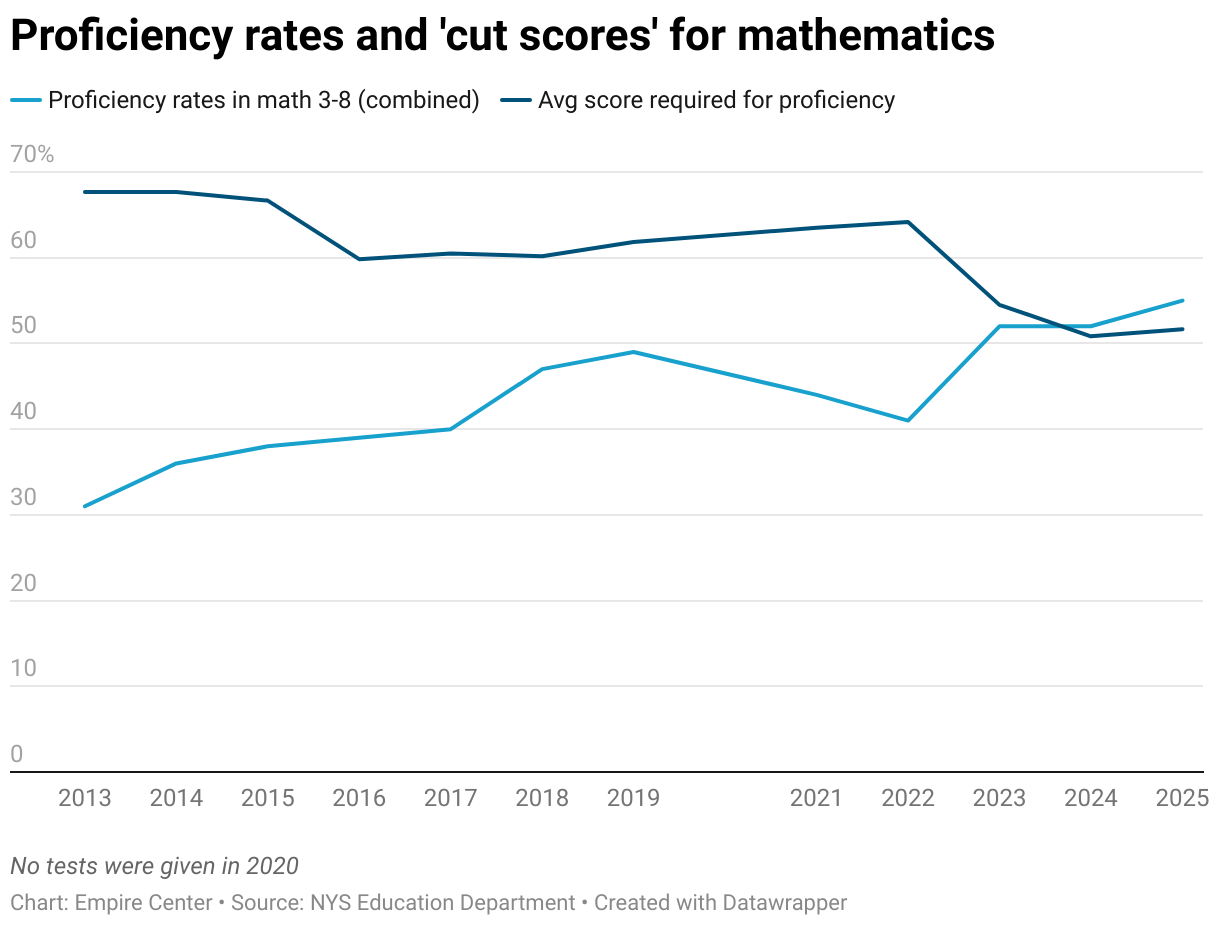
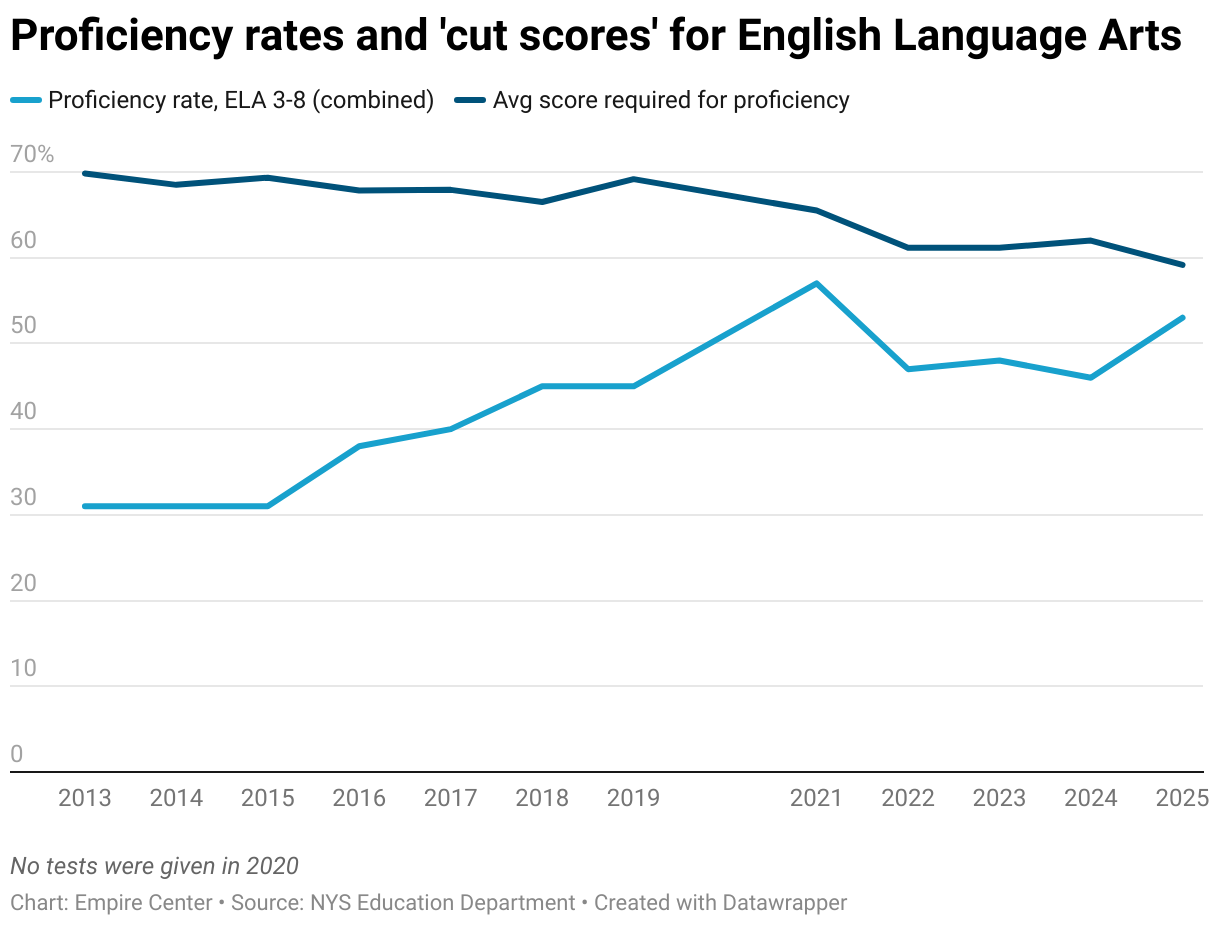
This raises concern that the rising proficiency levels reported by the state Education Department have been an illusion, the result of lowered standards rather than improved student performance.
The improvements reported by the state stand in contrast to New York’s results on the National Assessment of Educational Progress (NAEP), a set of tests administered by the federal government. Known as the Nation’s Report Card, it consists of math and reading tests given to a representative sample of students every other year in grades 4 and 8.
New York’s performance on NAEP tests has been sinking over the past dozen years, down three points in fourth-grade math, six points in fourth-grade reading, six points in eighth-grade math and four points in eighth-grade reading.
In addition to adjusting cut scores, the state has made other course corrections in its testing regime. In 2018, the Education Department said it was setting a new “baseline” after switching to tests that were administered over two days instead of three. In 2023, it said it was adjusting standards to reflect the “new normal” after the coronavirus pandemic. In each case, officials said the new proficiency rates should not be compared to those of the previous year – yet they posted the two years’ figures side by side.
Throughout all of this, the cut scores kept trending down, and the proficiency rates kept trending up.
The state stopped routinely posting its revised cut scores after 2022. However, when the state announced its 2024-25 test results earlier this month, the Albany Times Union requested and obtained the updated cut scores for 2023, 2024 and 2025 – information that had not previously been made public.
“More students passed this year’s math and English tests, but many of them didn’t have to do as well as last year to be named proficient,” reported the Times Union’s Kathleen Moore.
She quoted a spokeswoman for the department denying that the state had lowered its standards:
Each test is equated to the established scale. If there is a greater or lesser number of difficult questions one year, the number of questions that must be answered correctly is adjusted. This helps ensure that all tests in a subject are equated — no test is harder or easier to pass from year to year.
If that’s the case, then the double-digit declines in cut scores over the past 12 years would imply that all of the state’s tests have gotten steadily more difficult, something officials have not publicly asserted.
The Education Department has presumably conducted a technical analysis of each test before adjusting its cut score. By publishing these analyses, the department could give the public a better understanding of its scoring process – and a clearer idea of how well the public schools are doing their jobs.