

Elections occur every other November. But taxpayers vote with their feet every day, and these votes should be counted and tallied just like the votes for a November election.
A “Great Pandemic Wealth Migration” began when the coronavirus pandemic caused Americans to move to work-from-home employment. This meant workers were no longer tied to aphysical workplace, and families could now choose new locations based upon affordability and quality of life. At the same time, state and local taxes became more important to family and business locations because the 2017 Tax Cuts and Jobs Act (TCJA) dramatically reduced the federal deduction for state and local taxes paid.
Thus, when pandemic migration began, state and local taxes mattered more than ever before. The first year of pandemic migration showed Nebraska losing a record $500 million of annual income. New Internal Revenue Service (IRS) data shows that the migration moves continued into 2022, with Nebraska losing another $300 million of annual income.
IRS data is considered the gold standard of migration data because it collects the transfer of any taxpayer between states. For example, if a taxpayer filed from Indiana in 2021 and then from Nebraska in 2022, that taxpayer contributes to Nebraska’s “win” column of taxpayers, dependents, and income that moved into the Cornhusker State.
2021-2022 Nebraska Tax Migration Data
Nebraska experienced a net loss of 1,411 tax returns representing 1,953 people (tax filers plus their dependents) between 2021 and 2022, according to IRS data. This resulted in a net loss of nearly $300 million of annual adjusted gross income. Nebraska’s income loss is equal to 0.4% of Nebraska’s 2022 Adjusted Gross Income (AGI).
Nebraska gained the most people and income from California and then from neighboring Colorado. Notably, Nebraska also gained people and income from neighbors in Kansas and Wyoming. Nebraska lost people and income to neighbors in South Dakota, Missouri and Iowa. Nebraska had its greatest net loss of people to Texas (-1,206), and its greatest net loss of income toFlorida (-$121 million).
| State | Tax returns | Individuals | Adjusted Gross Income (AGI) |
| California | 509 | 1,254 | $ 34,683,000.0 |
| Colorado | 298 | 960 | $ 21,570,000.0 |
| Kansas | 73 | 170 | $ 1,269,000.0 |
| Utah | 0 | 112 | $ (18,723,000.0) |
| Hawaii | 36 | 108 | $ 3,391,000.0 |
| Nevada | 33 | 85 | $ (7,890,000.0) |
| Oregon | 19 | 83 | $ 1,838,000.0 |
| New York | -4 | 78 | $ (5,220,000.0) |
| Washington | -26 | 73 | $ 9,606,000.0 |
| Wyoming | 52 | 71 | $ (3,433,000.0) |
| Montana | 7 | 41 | $ (3,116,000.0) |
| Louisiana | 36 | 38 | $ 2,267,000.0 |
| New Mexico | 27 | 37 | $ 826,000.0 |
| Alaska | 19 | 29 | $ 2,094,000.0 |
| New Jersey | 5 | 18 | $ 736,000.0 |
| Rhode Island | 6 | 16 | $ 887,000.0 |
| Wisconsin | -10 | 14 | $ 716,000.0 |
| Arkansas | 6 | 3 | $ (1,349,000.0) |
| Vermont | -1 | 1 | $ 246,000.0 |
| Illinois | -51 | 0 | $ 12,817,000.0 |
| Maine | -11 | -7 | $ (1,908,000.0) |
| New Hampshire | 2 | -10 | $ (1,232,000.0) |
| West Virginia | -5 | -11 | $ (597,000.0) |
| Delaware | -6 | -12 | $ (435,000.0) |
| North Dakota | 10 | -18 | $ 802,000.0 |
| Kentucky | -5 | -18 | $ (917,000.0) |
| Connecticut | -7 | -18 | $ (2,085,000.0) |
| Maryland | -11 | -35 | $ (1,415,000.0) |
| District Of Columbia | -25 | -39 | $ (1,089,000.0) |
| Massachusetts | -33 | -42 | $ (455,000.0) |
| Idaho | -5 | -50 | $ (4,276,000.0) |
| Mississippi | -24 | -50 | $ (707,000.0) |
| Georgia | -37 | -56 | $ (10,094,000.0) |
| Oklahoma | -8 | -56 | $ (276,000.0) |
| Pennsylvania | -39 | -58 | $ (691,000.0) |
| Ohio | -44 | -88 | $ 36,000.0 |
| Alabama | -21 | -89 | $ (3,776,000.0) |
| Michigan | -35 | -91 | $ (4,025,000.0) |
| Indiana | -29 | -100 | $ (3,646,000.0) |
| Tennessee | -86 | -104 | $ (3,031,000.0) |
| South Carolina | -90 | -168 | $ (10,118,000.0) |
| Virginia | -71 | -200 | $ (10,236,000.0) |
| Minnesota | -134 | -208 | $ 15,924,000.0 |
| South Dakota | -142 | -229 | $ (28,000,000.0) |
| North Carolina | -144 | -256 | $ (12,463,000.0) |
| Missouri | -216 | -311 | $ (8,169,000.0) |
| Arizona | -245 | -345 | $ (84,880,000.0) |
| Iowa | -15 | -417 | $ (10,096,000.0) |
| Florida | -418 | -852 | $ (121,301,000.0) |
| Texas | -551 | -1,206 | $ (42,837,000.0) |
| Total | -1,411 | -1,953 | $ (298,777,000.0) |
2021-2022 U.S. Tax Migration Data
The nationwide picture showed continued flows of people and income leaving progressive coastal states like California, New York, and Illinois and flowing into more conservative Sunbelt states like Texas, Florida, Tennessee and the Carolinas. These moves picked up momentum during the beginning of the coronavirus pandemic, and IRS data shows that momentum continued through 2022.
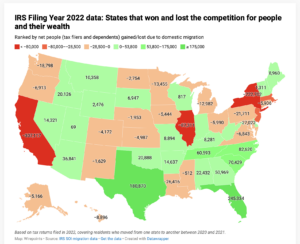
(click the map to interact with the data)
California lost over 300,000 people and nearly $24 billion of annual income while New York lost over 220,000 people and $14 billion of annual income. Florida gained nearly a quarter of a million and $36 billion of annual income while Texas gained 180,000 people and $10 billion of annual income.
| State | Net people gained/lost due to domestic migration | Net AGI gained/lost due to domestic migration |
| Florida | 245334 | $ 35,994,090,000 |
| Texas | 180870 | $ 10,138,261,000 |
| North Carolina | 82620 | $ 4,609,921,000 |
| South Carolina | 70429 | $ 4,758,069,000 |
| Tennessee | 60593 | $ 4,650,081,000 |
| Georgia | 50969 | $ 705,166,000 |
| Arizona | 36841 | $ 3,688,080,000 |
| Alabama | 22432 | $ 793,952,000 |
| Oklahoma | 20888 | $ 481,945,000 |
| Idaho | 20126 | $ 1,693,648,000 |
| Arkansas | 14637 | $ 467,529,000 |
| Nevada | 14321 | $ 3,086,260,000 |
| Montana | 10358 | $ 1,058,951,000 |
| Delaware | 9478 | $ 613,240,000 |
| Maine | 8960 | $ 702,125,000 |
| Missouri | 8894 | $ (581,865,000) |
| Kentucky | 8281 | $ 39,181,000 |
| South Dakota | 6947 | $ 583,293,000 |
| New Hampshire | 6412 | $ 887,466,000 |
| Indiana | 6326 | $ (550,632,000) |
| Wyoming | 2476 | $ 981,690,000 |
| West Virginia | 2017 | $ (43,589,000) |
| Vermont | 1311 | $ 269,572,000 |
| Wisconsin | 817 | $ (310,358,000) |
| Utah | 69 | $ 1,088,266,000 |
| Mississippi | -512 | $ 125,348,000 |
| New Mexico | -1629 | $ (131,934,000) |
| Nebraska | -1953 | $ (298,777,000) |
| North Dakota | -2754 | $ (251,967,000) |
| Rhode Island | -3027 | $ (130,671,000) |
| Colorado | -4172 | $ 1,471,071,000 |
| Kansas | -4987 | $ (607,715,000) |
| Alaska | -5166 | $ (312,922,000) |
| Iowa | -5444 | $ (516,858,000) |
| Connecticut | -5906 | $ (1,024,031,000) |
| Ohio | -5990 | $ (2,140,838,000) |
| Virginia | -6843 | $ (2,166,874,000) |
| Oregon | -6913 | $ (533,482,000) |
| Hawaii | -8896 | $ 348,037,000 |
| Michigan | -12982 | $ (1,366,289,000) |
| Minnesota | -13455 | $ (2,192,376,000) |
| Washington | -18798 | $ (1,658,538,000) |
| Pennsylvania | -21711 | $ (2,750,702,000) |
| Louisiana | -26416 | $ (882,363,000) |
| Maryland | -27022 | $ (2,718,149,000) |
| New Jersey | -37408 | $ (5,274,269,000) |
| Massachusetts | -45259 | $ (3,865,070,000) |
| Illinois | -87311 | $ (9,839,091,000) |
| New York | -222702 | $ (14,157,977,000) |
| California | -307117 | $ (23,791,963,000) |
Tax Reforms Needed, and Underway
The most recent IRS data covers moves undertaken a year before Nebraska’s 2023 legislative session. Since then, Nebraska has charted significant changes in its competitive trajectory.
In 2023, Nebraska’s top income tax rate was 6.64%. Nebraska enacted LB 754 to accelerate previous rate cuts and overhaul the state’s income tax structure. Cuts to the top rate are underway, with the top rate scheduled to fall from 5.2% to 4.55% on January 1, 2026.
- 5.84%, for taxable years beginning on or after January 1, 2024, and before January 1, 2025;
- 5.20%, for taxable years beginning on or after January 1, 2025, and before January 1, 2026;
- 4.55%, for taxable years beginning on or after January 1, 2026, and before January 1, 2027;
- 3.99%, for taxable years beginning on or after January 1, 2027.
Nebraska’s corporate tax is undergoing a similar rate reform. Like the individual income tax, the top corporate rate scheduled to hit 4.55% upon the turn of the New Year, and then 3.99% at the beginning of 2027.
Nebraska’s income tax reforms must continue to be a priority, and all rate cuts should be executed as planned in LB 754. In addition, Nebraska lawmakers must tackle the nation’s 4th – highest property tax burden with a suite of reforms to cut rates and tame the property tax base by eliminating Nebraska’s highly-uncompetitive inheritance tax and tangible personal property tax. All told, Nebraska has one of the least competitive property tax regimes in the entire country.
Nebraska is a year away from its next election, but every day is an election day in the competition between states. The Cornhusker State must continue to blaze a trail to greater competitiveness to attract the talent, families, and capital that will continue to build The Good Life in Nebraska.