
Introduction
The North Carolina Education Lottery was born in controversy and division, having squeaked through the General Assembly by a narrow, one-vote margin in 2005. In the almost 20 years since the legislation was passed, neither the controversy nor the division has subsided.
Today lottery tickets are marketed via noisy advertisements, press releases, and nightly televised drawings. There is no doubt that the North Carolina Education Lottery is a very visible contributor to education funding in the state. Since its inception the lottery has contributed $11.9 billion in education funding to schools. In 2021-22, public schools received $1.05 billion from the lottery. While the ever-growing dollars are a reality, what isn’t clear is the lottery’s actual effect on education spending.
Since the early years of the lottery, people on both sides of the aisle have worried about its effects on North Carolinians, especially its poorest, least educated, and most economically vulnerable. The fear that the lottery would prove to be a voluntary regressive tax has proven true. Counties with the highest lottery ticket sales per adult have historically been some of the state’s poorest and most economically distressed counties.
While the lottery has transferred a growing amount of money to the state’s General Fund for education, it has been sending a smaller and smaller proportion of its revenues to education, even though the ability to provide additional funding for education was the main argument that helped to win passage of the lottery in 2005. Nevertheless, a growing percentage of lottery funds are going instead to lottery prizes, administrative costs, and advertising.
The North Carolina Education Lottery was sold to boost education spending. Like most state lotteries, it has failed to deliver on its promise. Lottery money for education gives lawmakers and the public the impression that education needs are being met. As such, they are less likely to think that education is competing with other budget priorities for funding, even though it still is.
Does the education lottery boost state funding for education? That’s the intended purpose. However, lotteries are notorious for supplanting rather than supplementing education funding. What was expected to be new money in addition to an ongoing funding stream has wound up taking the place of some of the funding in the stream. As a result, budget writers then feel free to find “new money” for other spending items.
In 2022, a reported record $4.3 billion in lottery sales resulted in $1.05 billion dollars forwarded for education. Quick math reveals that’s about 23 cents of every dollar spent on the lottery actually goes to education. How was that small proportion of lottery dollars divided in 2021-22? This past year, about 86% went to either school construction ($525 million, or 49.7%) or Non-Instructional Support Personnel ($386 million, or 36.5%). The other expenditures – pre-kindergarten, college scholarships, UNC need-based aid, and local school transportation – totaled only about 14% of all expenditures. Revised budgets for 2023 are similar, with 40% devoted for school construction and about 44% dedicated for Non-Instructional Support Personnel. Actual amounts spent are not available as of this writing.
Are lottery funds getting into the classroom? It is not difficult to see how school construction and personnel costs absorbed the majority of lottery expenditures the last few years. They are paying for educational expenditures. If you track expenditures over the last few years, however, lottery dollars are increasingly being used for nonclassroom expenditures.
Is the lottery aiding education? Or merely supplanting dollars that North Carolina would have spent on education anyway? That’s a question that has not been fully answered but requires closer scrutiny.
Key Facts
- The North Carolina Education Lottery continues to encounter strong opposition. Many North Carolinians on both sides of the aisle consider gaming immoral. Some also believe that the lottery is unethical in that it takes advantage of the poor and undereducated. Others have religious objections to gambling. That the North Carolina Education Lottery is a state monopoly only heightens these concerns.
- From the lottery’s beginning, data have consistently shown lottery sales come disproportionately from the least well-off counties. Counties with high poverty rates, high unemployment rates, and high property tax rates also tend to have high lottery sales per adult.
- A review of 2019-20 lottery sales (the most recent data available as of this writing) found the top 10 counties in lottery sales per adult were among the most economically distressed counties in the state. Lottery sales per adult in those counties ($736.53) were almost twice the state average ($374.94) of lottery sales per adult and nearly twoand-a-quarter times greater than the average in the 20 most well-off counties in the state.
- Schools continue to spend the large amounts of lottery money on nonclassroom expenses. Does that mean the lottery is paying for expenses that would have been financed in another way?
- Each year the General Assembly decides how lottery money is to be apportioned by category. This decision allows lawmakers to be able to respond to urgent funding needs, but it also makes it easier for lawmakers to thwart the original purpose of lottery funding to get more resources into the classroom.
Recommendations
1. End the state lottery and return to direct, transparent education funding.
Education should be treated like all other budget priorities, with spending priorities subject to open debate and discussion.
2. If North Carolina approves private gaming to provide for education revenue, the North Carolina State Lottery should be ended.
Ending the state lottery monopoly wouldn’t mean an end to gambling revenue for education. If taxed like other gambling ventures, private enterprises would also contribute to education spending.
3. Put in statute that the majority of North Carolina Education Lottery funds must be allocated for public schools.
Measures must be taken to ensure that lottery money is allocated and spent in accordance with public intentions. In recent years, too much money has been siphoned away from the classroom and spent on other expenses, such as college scholarships, prekindergarten programs, and school construction.
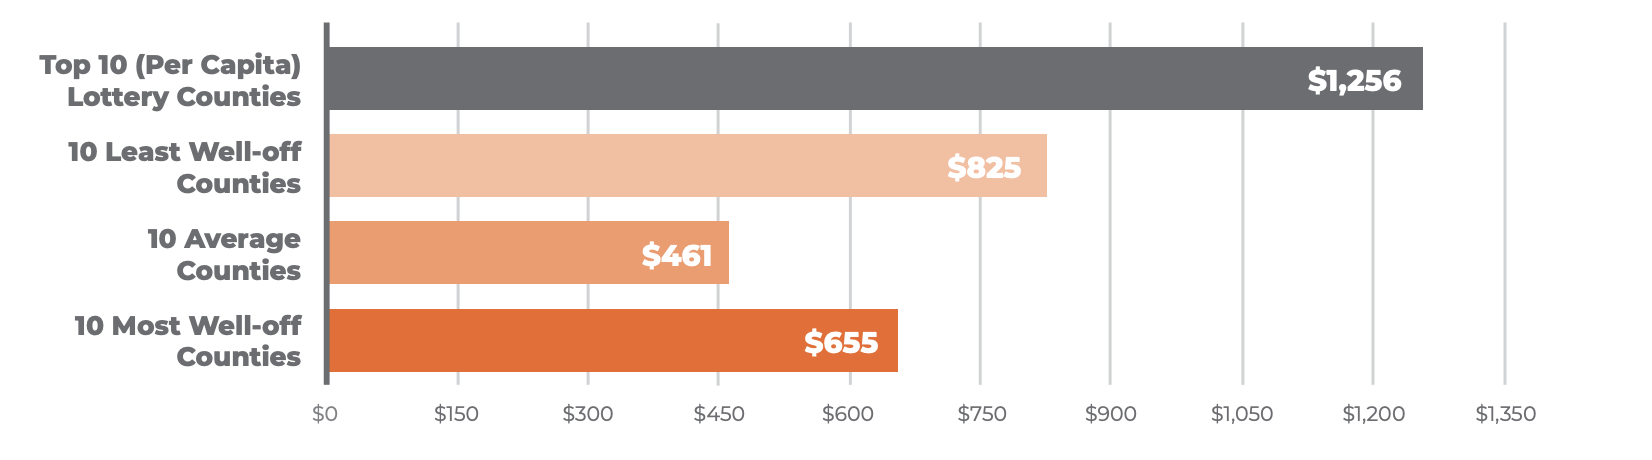
Average Per-Capita Sales by County Type

Note: Chatham County, which is included in the well-off county average, is an outlier with per-capita lottery sales exceeding $2,500. Excluding Chatham County, the well-off county average falls to $361, revealing a much greater disparity when compared with the $825 average of the 10 least well-off counties.
County Lottery Sales Per Adult and Economic Well-Being — 2022
Unemployment and County Lottery Sales
| County Unemployment | Number of Counties | Sales Per Adult |
|---|---|---|
| Below 4% | 65 | $476 |
| Between 4–5% | 18 | $570 |
| Between 5–6% | 11 | $718 |
| Over 6% | 6 | $872 |
Median Income and County Lottery Sales
| County Median Income | Number of Counties | Sales Per Adult |
|---|---|---|
| Over $60K | 20 | $298 |
| Between $50–60K | 34 | $371 |
| Between $40–50K | 42 | $364 |
| Below $40K | 4 | $522 |
Sources: https://www.bls.gov/lau/lastrk22.htm; https://www.commerce.nc.gov/report-county-tiers-ranking-memo-current-year/download?attachment; https://www.commerce.nc.gov/report-county-tiers-ranking-memo-current-year/download?attachment
Poverty Rates and County Lottery Sales
| County Poverty Rate | Number of Counties | Sales Per Adult |
|---|---|---|
| Below 12% | 20 | $543 |
| Between 12–16% | 38 | $400 |
| Between 16–20% | 19 | $459 |
| Between 20–24% | 18 | $708 |
| Over 24% | 5 | $850 |
Property Taxes and County Lottery Sales
| County Property Tax Rate | Number of Counties | Sales Per Adult |
|---|---|---|
| 43 | $590 | |
| $100K–$120K | 10 | $1,064 |
| $121K–$140K | 16 | $382 |
| $141K–$160K | 11 | $435 |
| >$160K | 20 | $936 |
Sources: https://www.census.gov/quickfacts/fact/table/yanceycountynorthcarolina,NC/PST045222; https://www.commerce.nc.gov/report-county-tiers-ranking-memo-current-year/download?attachment
2021-22 Lottery Funding
| Program | Amount Assigned | Percentage |
|---|---|---|
| Non-Instructional Support Personnel | $385,914,455 | 36.5 |
| Pre-Kindergarten | $78,252,110 | 7.4 |
| School Construction | $525,785,890 | 49.7 |
| College Scholarships | $35,755,184 | 3.4 |
| UNC Need-based Aid | $10,328,843 | 1 |
| LEA Transportation | $21,386,390 | 2 |
Source: North Carolina Education Lottery
NC Education Lottery Expenditures for Education Programs by Year
| Fiscal Year | Amount |
|---|---|
| 2007–08 | $325,533,152 |
| 2007–08 | $350,007,430 |
| 2008–09 | $412,425,969 |
| 2009–10 | $419,463,271 |
| 2010–11 | $462,856,959 |
| 2011–12 | $457,380,272 |
| 2012–13 | $473,492,963 |
| 2013–14 | $481,832,724 |
| 2014–15 | $584,635,507 |
| 2015–16 | $528,995,331 |
| 2016–17 | $593,527,109 |
| 2017–18 | $674,117,350 |
| 2018–19 | $761,736,062 |
| 2019–20 | $692,840,646 |
| 2020–21 | $744,351,537 |
| 2021–22 | $1,057,422,572 |
| Total | $9,020,618,854 |
Source: North Carolina Education Lottery