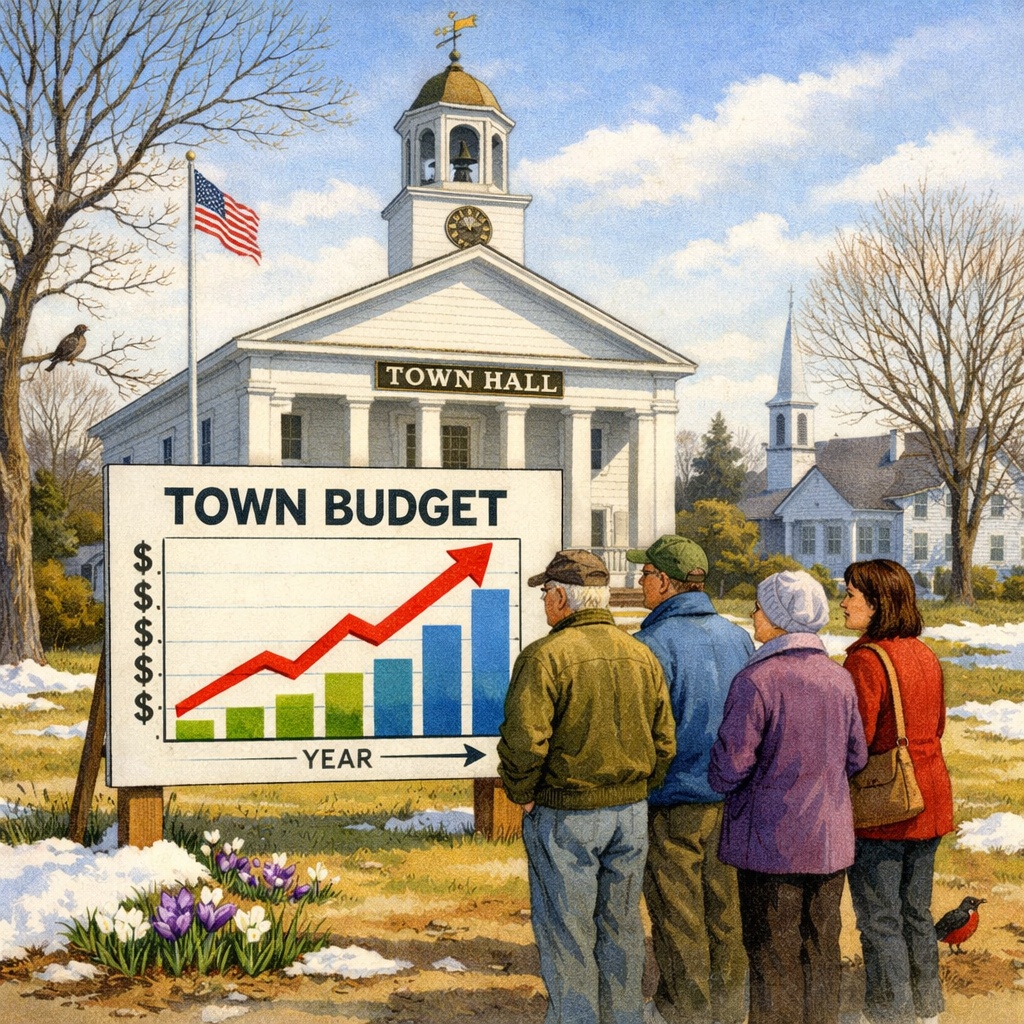
New Hampshire’s cherished tradition of self-government has become eroded by the ever-increasing complexity of modern government. It is eroded further by the practice of sharing only very limited information with voters before and during local elections. A house bill this session would arrest this erosion by empowering voters with detailed but easy-to-understand information about their town’s spending and taxation.
Every spring, voters decide the fate of municipal budgets based on a tiny amount of information. Typically they are presented only with total figures for the current and proposed budgets. Those figures tell voters next to nothing about the overall quality of fiscal management in their town.
The only way to get a clearer picture of how well local officials manage taxpayer resources is to look at the numbers over time. That, along with other basic budget info, is what House Bill 1516 would provide.
The bill would require that municipalities vote on whether to post online, or make copies available if there is no town website, detailed budget information going back a decade.
Municipalities that vote for this budget transparency must post a pie chart illustrating how the budget breaks down into the following categories: state education, school, city or town, county, and precinct or village district.
Municipalities would also have to provide a line graph showing the change in each line item over the previous decade.
These charts by themselves would give voters vastly more municipal budget information than they have ever received before. Yet complying with this requirement would not require a computer programmer or accountant. Microsoft Excel can create quick charts and graphs from existing spreadsheets. Or staff can use one of several artificial intelligence options to create the required graphics. This is not a heavy lift.
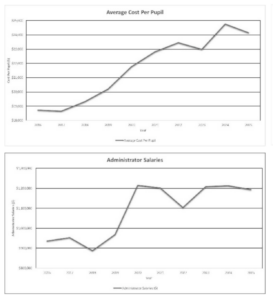
Inspired by Josiah Bartlett Center charts showing trends in school spending over time, legislators in 2024 passed a law requiring school districts to create 10-year charts showing per-pupil costs, teacher pay and administrator pay. Similar transparency for the rest of local government would be easy to achieve.
Here are Exeter’s charts showing the annual change in average per pupil spending and total administrator pay over the last decade. It’s easy to see how these basic graphics can stimulate productive conversations about local spending priorities and their tax impacts.
The graphics requirements in HB 1516 alone would be a revelation. The simple visual representations of local government spending would create a more complete picture of local finances than anything voters have ever had at their disposal, and voters could understand the information in seconds. (The data would make great fodder for high school math, economics and statistics courses too.)
The bill also would require links to source documents, including the most recent city or town report, the disclosure of state funding already required by law and minutes of meetings at which the most recent budgets were adopted.
Interested voters could dive as deep as they want into their local budgets. But for most voters, the graphics will suffice.
Both political parties have proclaimed a passionate desire to cut local property taxes. HB 1516 would not cut taxes directly, but it would inform voters just how much their local governments have increased spending over time. The prominent disclosure of that information alone would put pressure on local officials to restrain future spending increases, which is the only way to slow the growth of property taxes.
Even discounting the possible property tax effects, empowering voters with more information about local government operations would seem to align with the stated goals of both major political parties.