
Introduction
In 2022, North Carolina spent over $16.7 billion on K-12 public education. Was the money used wisely? Answering that question involves informal as well as formal processes. Informally, parents render their own assessments by choosing to stay or leave certain schools or districts. Voting with their feet is a powerful way for parents to express their sentiments and hold public institutions many of them monopolies – accountable for achieving results.
A more conventional or formal way to hold public schools accountable is to gauge how well students are learning and how well schools are teaching.
The North Carolina READY Accountability Model was developed in 2012 to provide data to answer those questions. The READY Accountability Model consists of: (1) a standard course of study focused on most critical skills and knowledge needed to be successful, (2) assessments that require students to express and support their ideas, and (3) an accountability model that measures how well schools are doing to ensure that students are collegeand career-ready upon graduation.
As part of the READY Accountability initiative, the North Carolina Department of Public Instruction (DPI) developed – and tested – nearly all end-of-grade and end-of-course tests to be administered in grades K-12, an unusual but nonetheless factual development. In addition, the READY model annually assigns A-F grades to schools based on calculations that combine school achievement and school growth using a 15-point grading scale. Student career and college readiness is reported using five different achievement levels.
READY has been dogged by persistent criticism. The formula for calculating school grades and the proper weighting of school achievement and school growth have been topics of endless debate and discussion. In recent years, there has been a push to revise the model to factor in other indicators of school quality, such as postsecondary outcomes, school climate, and rates of chronic absenteeism.
The 2023 expansion of North Carolina’s Opportunity Scholarship voucher program to universal eligibility raised important questions about the nature of accountability and whether traditional measures of accountability have been successful. Is accountability a top-down affair, ensured by governmental regulations and measured primarily by standardized test results? Or is accountability best understood from a bottom-up perspective and measured by whether parents choose to keep their children enrolled in a particular school? Indeed, the traditional measures of accountability seem to have fallen short. Despite the fact that spending on the public school system continues to increase year after year, test scores indicate that many students still can’t read or do math at grade level.
Key Facts
- The federal government requires that North Carolina administer end-of-grade tests and report results in reading and math (grades 3-8) and science (grades 5 and 8). High school students must take end-of-course tests in English II, Math I, Math III, and Biology.
- State assessments gauge career and college readiness using a five-level achievement scale. Levels 3, 4, and 5 meet the “on grade level” proficiency standard. Levels 4 and 5 meet the “career and college readiness” standard.
- Although student test scores have been approaching pre-Covid performance levels, there is still room for improvement. For example, in 2022-23, 47.8% of third graders demonstrated grade-level proficiency in reading on the end-of-grade test. The percentage of third graders meeting this standard was higher than in 2021-22 (46.4%) and 2020-21 (45.1%) but less than before the pandemic (56.8% in 2018-19).
- North Carolina also participates in a federal testing program, the National Assessment of Educational Progress (NAEP), perhaps more commonly known as the Nation’s Report Card. NAEP samples 4th, 8th, and 12th grade students and provides state-level results in 4th and 8th grade Mathematics, Reading, Science, and Writing. Other grades and samples are used for assessing long-term trends. NAEP’s main value is to provide a basis of comparison with other states and the nation.
- Since 2019, state law has required combining careerand college-readiness indicators for school performance grades, which are mandated under both state and federal reporting requirements. It also required the State Board of Education to include collegeand career-readiness information on annual school report cards.
- The Testing Reduction Act of 2019 eliminated the NC Final Exams beginning with the 2020-21 school year. The legislation also stated the General Assembly’s intent to move toward a “through-grade assessment model,” which places an emphasis more on formative assessments, for all state-mandated assessments. It also required school district boards of education to review local standardized testing requirements every two years.
- In spring of 2020, owing to disruptions in education caused by policy responses to Covid-19, North Carolina received a waiver from the federal government exempting the state from all end-of-grade and end-of-course testing requirements as well as from diagnostic and formative reading assessments for grades K-3. Because of the lack of data collection, school performance grades and school report cards were not calculated for 2019-20.
- In September 2021, Superintendent of Public Instruction Catherine Truitt released her plans for Operation Polaris, a four-year strategic plan to improve outcomes for public-school students. One focus area of Operation Polaris, revised and expanded in January 2023, is redesigning testing and accountability.
- One key component of North Carolina’s READY Accountability Model is school performance grades. Currently, 80% of the grade is based on academic achievement as shown by standardized test scores, while the other 20% is based on students’ academic growth compared with the previous year.
- In May 2023, the Department of Public Instruction presented a series of proposed changes to the state’s accountability framework at the State Board of Education’s monthly meeting. The recommendations were developed by an advisory committee consisting of policy experts, state leaders, and education practitioners. The committee suggested studying eight indicators for possible inclusion into the performance grading system: five-year graduation rates, improvement in student subgroup performance, rates of chronic absenteeism, postsecondary inputs and outcomes, participation in extracurricular or intra-curricular activities, durable skills, and school climate.
Recommendations
1. Allow Districts to Adopt an Independent National Test of Student Performance
The end-of-grade and end-of-course assessments developed by DPI are controversial, were not independently developed, and required revisions to get the quality of the tests to where they needed to be. Districts should be able to choose from an array of nationally recognized achievement tests (such as the Stanford Achievement Test and Iowa Test of Basic Skills) to provide another measure of student performance.
2. Provide Children Who Attend Failing Schools the Option of in-School Tutoring
In the wake of Covid shutdowns, student assessments needed a recalibration. Grants should be provided to students for assessing academic progress and needs. Parents should have access to a variety of options to address their child’s academic shortcomings, including traditional tutoring, online coaching, or summer or evening classes.
3. Explore Ways to Strengthen Accountability by Tying Funding to Gains in Student Achievement
States such as Arizona, Tennessee, and Florida have experimented with different ways to allocate funding to K-12 schools based in part on improving academic outcomes.
North Carolina should explore ways to use performance-based funding to reward high-performing schools and districts. Steps toward implementing performance-based funding could include convening a study commission or legislative study committee to examine other states’ models and recommend ways to tailor them for North Carolina. Policymakers could also consider implementing a voluntary pilot program that tests a performance-based funding model in select schools or districts.
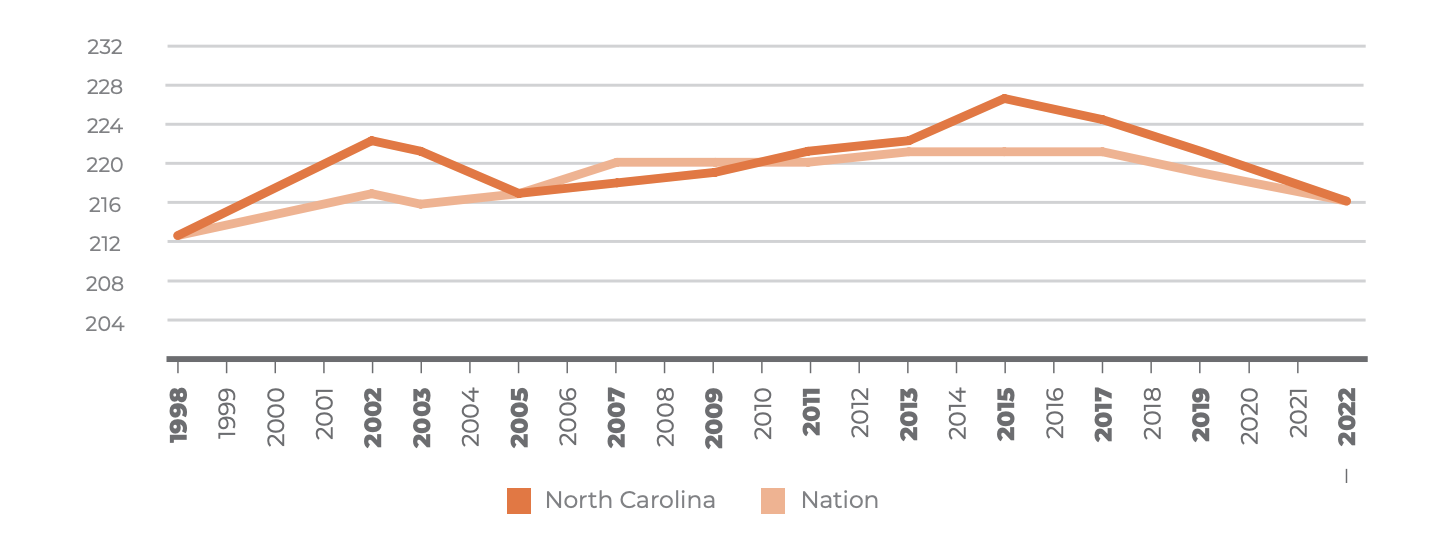
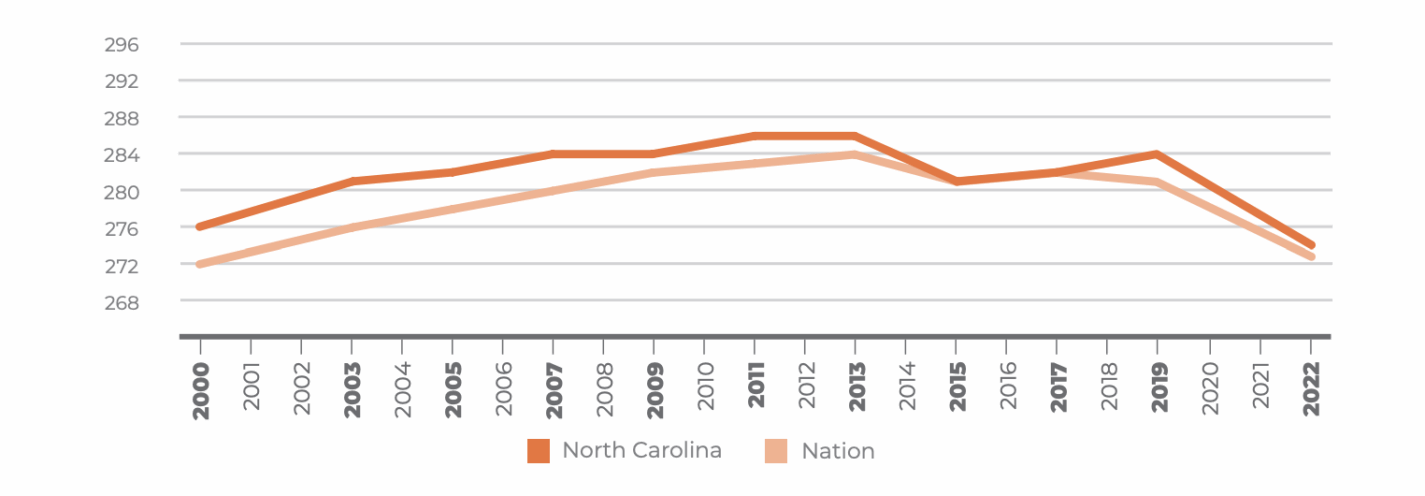
NAEP Scores: Fourth-Grade Reading
Source: National Assessment of Educational Progress (NAEP) average scale scores
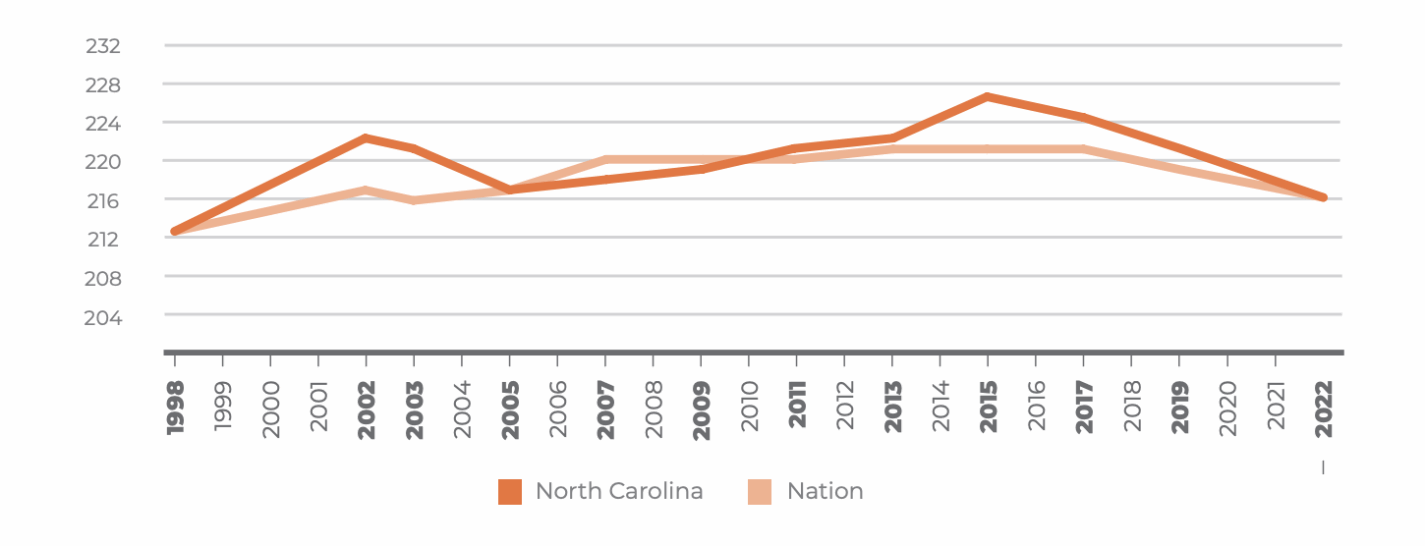
NAEP Scores: Eighth-Grade Reading
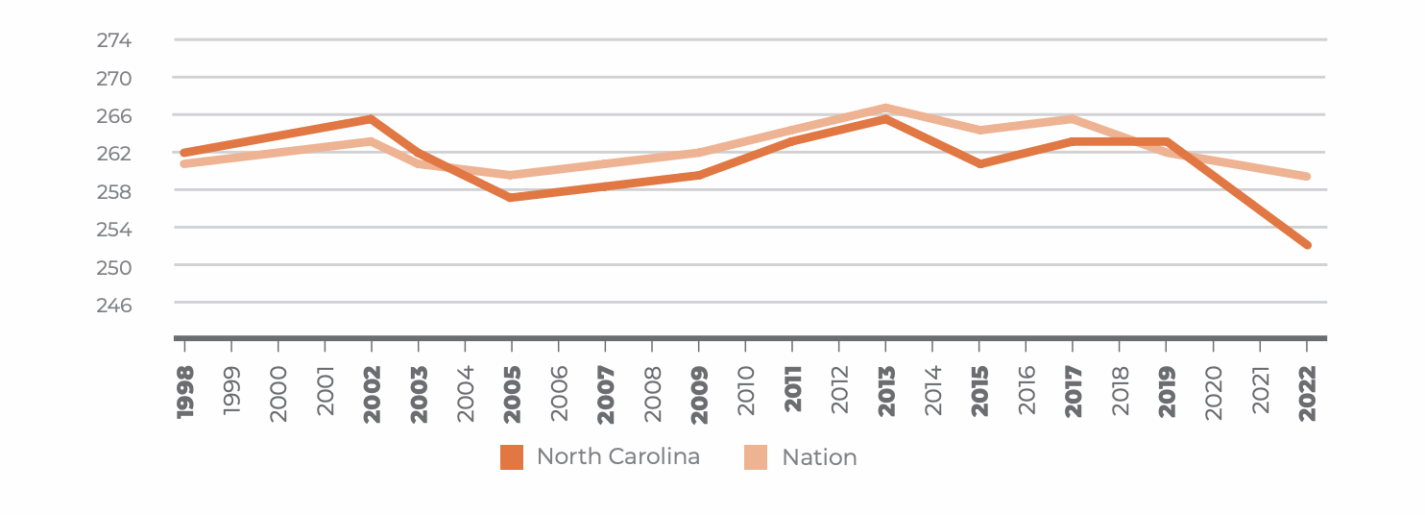
NAEP Scores: Fourth-Grade Mathematics
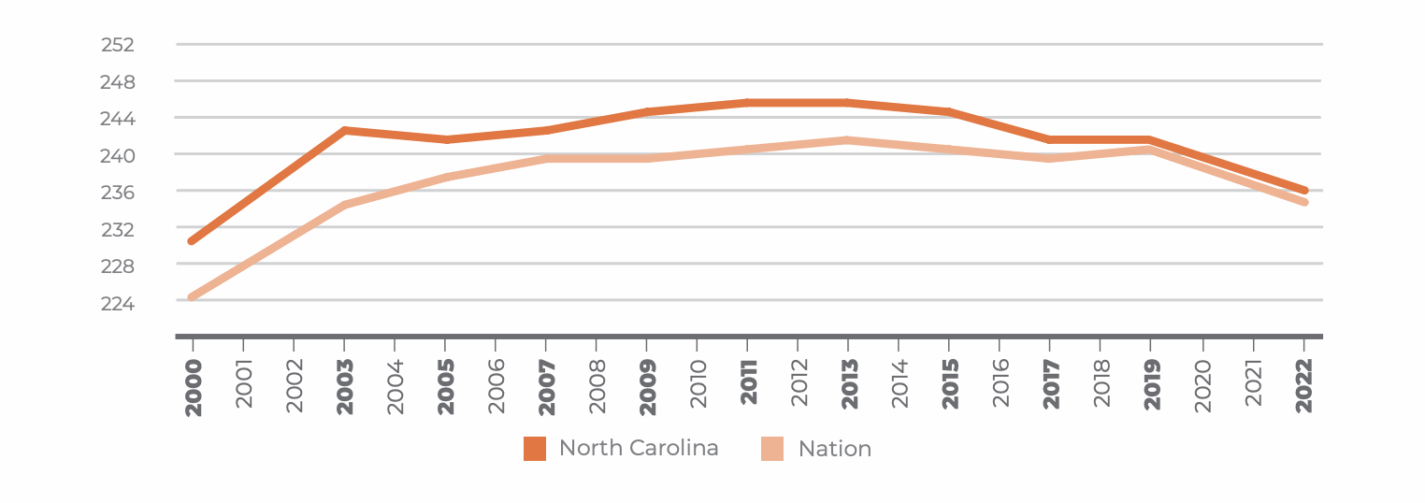
NAEP Scores: Eighth-Grade Mathematics
Source: National Assessment of Educational Progress (NAEP) average scale scores
Average SAT Scores
| Year | Jurisdiction | Reading | Mathematics | Total |
|---|---|---|---|---|
| 2023 | National | 510 | 493 | 1003 |
| 2023 | North Carolina | 567 | 556 | 1122 |
| 2022 | National | 521 | 507 | 1028 |
| 2022 | North Carolina | 569 | 561 | 1130 |
| 2021 | National | 524 | 514 | 1038 |
| 2021 | North Carolina | 575 | 572 | 1147 |
| 2020 | National | 520 | 510 | 1030 |
| 2020 | North Carolina | 548 | 540 | 1089 |
| 2019 | National | 524 | 515 | 1039 |
| 2019 | North Carolina | 549 | 542 | 1091 |
| 2018 | National | 529 | 520 | 1049 |
| 2018 | North Carolina | 550 | 540 | 1090 |
| 2017 | National | 527 | 517 | 1044 |
| 2017 | North Carolina | 542 | 532 | 1074 |
| 2016 | National | 487 | 494 | 981 |
| 2016 | North Carolina | 502 | 508 | 1010 |
| 2015 | National | 495 | 511 | 1006 |
| 2015 | North Carolina | 498 | 504 | 1002 |
| 2014 | National | 497 | 513 | 1010 |
| 2014 | North Carolina | 499 | 507 | 1006 |
| 2013 | National | 496 | 514 | 1010 |
| 2013 | North Carolina | 495 | 506 | 1001 |
| 2012 | National | 496 | 514 | 1010 |
| 2012 | North Carolina | 491 | 506 | 997 |
| 2011 | National | 497 | 514 | 1011 |
| 2011 | North Carolina | 493 | 508 | 1001 |
| 2010 | National | 500 | 515 | 1015 |
| 2010 | North Carolina | 497 | 511 | 1008 |
| 2009 | National | 499 | 514 | 1013 |
| 2009 | North Carolina | 495 | 511 | 1006 |
| 2008 | National | 500 | 514 | 1014 |
| 2008 | North Carolina | 496 | 511 | 1007 |
| 2007 | National | 501 | 514 | 1015 |
| 2007 | North Carolina | 495 | 509 | 1004 |
| 2006 | National | 503 | 518 | 1021 |
| 2006 | North Carolina | 495 | 513 | 1008 |
| 2005 | National | 508 | 520 | 1028 |
| 2005 | North Carolina | 499 | 511 | 1010 |
Note: The College Board began administering a new SAT in March 2016. SAT scores after 2016 are not directly comparable with average scores from previous years. Beginning in 2017, average scores are for public school students only.
Source: College Board
Average ACT Scores
| Year | Jurisdiction | English | Math | Reading | Science | Composite |
|---|---|---|---|---|---|---|
| 2023 | National | 18.6 | 19.0 | 20.1 | 19.6 | 19.5 |
| 2023 | North Carolina (Graduates) | 16.9 | 18.3 | 19.3 | 18.9 | 18.5 |
| 2023 | North Carolina (11th Grade) | 16.6 | 18.1 | 18.9 | 18.5 | 18.2 |
| 2022 | National | 19.0 | 19.3 | 20.4 | 19.9 | 19.8 |
| 2022 | North Carolina (Graduates) | 17.1 | 18.5 | 19.2 | 18.8 | 18.5 |
| 2022 | North Carolina (11th Grade) | 16.4 | 18.1 | 19.0 | 18.6 | 18.2 |
| 2021 | National | 19.6 | 19.9 | 20.9 | 20.4 | 20.3 |
| 2021 | North Carolina (Graduates) | 17.3 | 19.0 | 19.4 | 19.3 | 18.9 |
| 2021 | North Carolina (11th Grade) | 16.7 | 18.3 | 18.9 | 18.6 | 18.2 |
| 2020 | National | 19.9 | 20.2 | 21.2 | 20.6 | 20.6 |
| 2020 | North Carolina (Graduates) | 17.3 | 18.9 | 19.5 | 18.9 | 18.8 |
| 2020 | North Carolina (11th Grade) | N/A | N/A | N/A | N/A | N/A |
| 2019 | National | 20.1 | 20.4 | 21.2 | 20.6 | 20.7 |
| 2019 | North Carolina (Graduates) | 17.8 | 19.2 | 19.4 | 19.0 | 19.0 |
| 2019 | North Carolina (11th Grade) | 16.7 | 18.6 | 19.0 | 18.6 | 18.4 |
| 2018 | National | 20.2 | 20.5 | 21.3 | 20.7 | 20.8 |
| 2018 | North Carolina (Graduates) | 18.0 | 19.3 | 19.5 | 19.2 | 19.1 |
| 2018 | North Carolina (11th Grade) | 17.2 | 18.9 | 18.8 | 18.6 | 18.5 |
| 2017 | National | 20.3 | 20.7 | 21.4 | 21.0 | 21.0 |
| 2017 | North Carolina (Graduates) | 17.8 | 19.3 | 19.6 | 19.3 | 19.1 |
| 2017 | North Carolina (11th Grade) | 17.4 | 18.9 | 18.9 | 18.8 | 18.6 |
| 2016 | National | 20.1 | 20.6 | 21.3 | 20.8 | 20.8 |
| 2016 | North Carolina (Graduates) | 17.8 | 19.4 | 19.5 | 19.2 | 19.1 |
| 2016 | North Carolina (11th Grade) | 17.1 | 18.9 | 19.0 | 18.9 | 18.6 |
| 2015 | National | 20.4 | 20.8 | 21.4 | 20.9 | 21.0 |
| 2015 | North Carolina (Graduates) | 17.6 | 19.5 | 19.2 | 19.0 | 19.0 |
| 2015 | North Carolina (11th Grade) | 17.1 | 19.0 | 18.8 | 18.7 | 18.6 |
| 2014 | National | 20.3 | 20.9 | 21.3 | 20.8 | 21.0 |
| 2014 | North Carolina (Graduates) | 17.5 | 19.6 | 19.0 | 18.9 | 18.9 |
| 2014 | North Carolina (11th Grade) | 17.0 | 19.2 | 18.7 | 18.6 | 18.5 |
| 2013 | National | 20.2 | 20.9 | 21.1 | 20.7 | 20.9 |
| 2013 | North Carolina (Graduates) | 17.1 | 19.6 | 18.8 | 18.7 | 18.7 |
| 2013 | North Carolina (11th Grade) | 16.9 | 19.2 | 18.4 | 18.6 | 18.4 |
| 2012 | National | 20.5 | 21.1 | 21.3 | 20.9 | 21 |
| 2012 | North Carolina (Graduates) | 21.0 | 22.3 | 22.2 | 21.4 | 21.9 |
| 2012 | North Carolina (11th Grade) | 16.4 | 19.3 | 18.3 | 18.3 | 18.2 |
| 2011 | National | 20.6 | 21.1 | 21.3 | 20.9 | 21.2 |
| 2011 | North Carolina | 21.2 | 22.4 | 22.2 | 21.4 | 21.9 |
| 2010 | National | 20.5 | 21.0 | 21.3 | 20.9 | 21.0 |
| 2010 | North Carolina | 21.1 | 22.3 | 22.2 | 21.6 | 21.9 |
| 2009 | National | 20.6 | 21.0 | 21.4 | 20.9 | 21.1 |
| 2009 | North Carolina | 20.9 | 22.0 | 21.9 | 21.1 | 21.6 |
| 2008 | National | 20.6 | 21.0 | 21.4 | 20.8 | 21.1 |
| 2008 | North Carolina | 20.5 | 21.8 | 21.7 | 20.8 | 21.3 |
| 2007 | National | 20.7 | 21.0 | 21.5 | 21.0 | 21.2 |
| 2007 | North Carolina | 20.2 | 21.4 | 21.4 | 21.0 | 21.0 |
| 2006 | National | 20.6 | 20.8 | 21.4 | 20.9 | 21.1 |
| 2006 | North Carolina | 19.6 | 20.9 | 20.9 | 20.2 | 20.5 |
| 2005 | National | 20.4 | 20.7 | 21.3 | 20.9 | 20.9 |
| 2005 | North Carolina | 19.3 | 20.4 | 20.6 | 20.0 | 20.2 |
Note: Beginning in March 2012, the ACT has been administered to all 11th-grade public school students in North Carolina.
Source: ACT, Inc.