

Evidence from border counties indicates increased economic freedom encourages prosperity

Executive summary
Starting in the early 2010s, Wisconsin undertook market-oriented policy reforms that substantially enhanced economic freedom in the state as measured by two widely cited indices. This analysis uses data from border counties with Illinois and Minnesota and state-level migration data to assess the impact of Wisconsin’s “experiment in economic freedom” on the state‘s economic performance.
- Throughout most of the 20th century, Wisconsin’s policy environment was generally characterized by high taxes, strict business regulation, and labor laws that favored unionization. This was an expression of the Progressive governance model, of which Wisconsin was one of the first adopters.
- Beginning around 2011 Wisconsin broke sharply with that tradition and began an “experiment in economic freedom.” The major policy changes driving this shift included significant reductions in the state and local tax burden, the enactment of right-to-work legislation, the passage of Act 10, and the introduction of a targeted tax credit that dramatically reduced effective tax rates on income from manufacturing and agricultural activities.
- These reforms increased the state’s ranking in widely cited indices that measure economic freedom. In the early 2000s, Wisconsin consistently placed near the bottom of these rankings. During the 2010s, Wisconsin quickly climbed into the second quintile in both major indices, where it remains today.
- This paper assesses the impact of these reforms by comparing economic growth in Wisconsin’s border counties with counties on the other side of the border in Illinois and Minnesota (both of which remain near the bottom of state economic freedom rankings). This analysis supports the view that Wisconsin’s market-oriented reforms promoted growth. Further, analysis of interstate migration shows that Wisconsin has fared better in attracting and retaining working-age and higher-income taxpayers than these neighboring states since the reform era began. These results are consistent with decades of international and state-level evidence showing a strong link between increased economic freedom and prosperity.
- The gains from Wisconsin’s experiment in economic freedom are real but fragile. Recent proposals in Madison include a higher top income tax rate, rollback of the manufacturing and agriculture tax credit, repeal of Act 10, and repeal of right-to-work. Lawmakers will decide in the years ahead whether to return to the Progressive model or continue Wisconsin’s experiment in economic freedom.
Introduction
The American states are often likened to “laboratories of democracy.”1 The federal constitution provides states with the ability to pursue economic, social, and political experiments within their borders so long as these experiments do not run afoul of federal law or usurp powers the constitution specifically grants to the federal government.
Wisconsin was at the center of the Progressive movement of the early 20th century. The progressives took a dim view of capitalism. They viewed it as a source of economic disorder and waste and markets as both morally unsound and obsolete.2 But at the same time, they rejected European-style worker-led socialism.3 Instead, progressives advocated what they saw as a “third way”: an economy managed by experts. Many of the leading economic thinkers of the progressive movement were faculty at the University of Wisconsin. These credentialed experts would put their ideas into action by influencing and directing policy in Wisconsin. This came to be known as the “Wisconsin idea.”4
The 20th century could be viewed as Wisconsin’s progressive century. Wisconsin was the first state to establish a personal income tax (1911) and to allow collective bargaining by public sector unions (1959). Business regulation was strict.5 Labor laws favored unionization. Taxes were high. The tax burden on Wisconsinites at the end of the 20th century was the second highest in the nation.
Then, after a century of progressivism, Wisconsin broke with its past.
Starting in 2011, Wisconsin undertook a new experiment, this time in free-market economics. This is Wisconsin’s experiment in economic freedom or, as referred to in the rest of this chapter, the “Wisconsin experiment.” In little more than a decade, Wisconsin was transformed from one of the most government-centric states to one that is now ranked in the top half in terms of economic freedom. Wisconsin is no longer an extraordinarily high-tax state. The tax burden on Wisconsinites is closer to the U.S. average. Labor markets in Wisconsin have become more flexible. Government spending has been restrained. Twenty years ago, its adherence to progressive ideals made Wisconsin an outlier among states. Today economic policy in Wisconsin is closer to the norm.
This chapter will examine the policy behind the Wisconsin experiment, measuring change with the economic freedom indices compiled by two leading research organizations. It also examines economic data from border counties for evidence on whether the experiment succeeded: That is, did the changes make Wisconsin more prosperous and increase economic opportunity? The answer comes from benchmarking the economic performance of Wisconsin’s border counties against those in Illinois and Minnesota, neighbors without recent major pro-market reforms. Evidence shows that growth in Wisconsin border counties has been stronger than on the opposite side in the reform era and that Wisconsin has been more successful at attracting and retaining interstate migrants. I conclude with a discussion of the future of the Wisconsin experiment. Wisconsin remains divided: Unlike states in which free-market policies are well-established, our experiment remains a fragile one.
Wisconsin’s experiment in economic freedom
Economic freedom is about choice. In a free-market economy, individuals have the ability to choose how to use their labor and property, to invest and enter into contracts, to start businesses, and to compete with others. Individuals have the ability to pursue new, creative, and innovative ideas. Decentralization of decision-making allows individuals to use specialized, localized knowledge to craft solutions to problems that a central planner could never fully grasp or anticipate. Free-market economies are characterized by low taxation and government spending, flexible labor markets, limited government regulation of business and industry, and secure property rights.
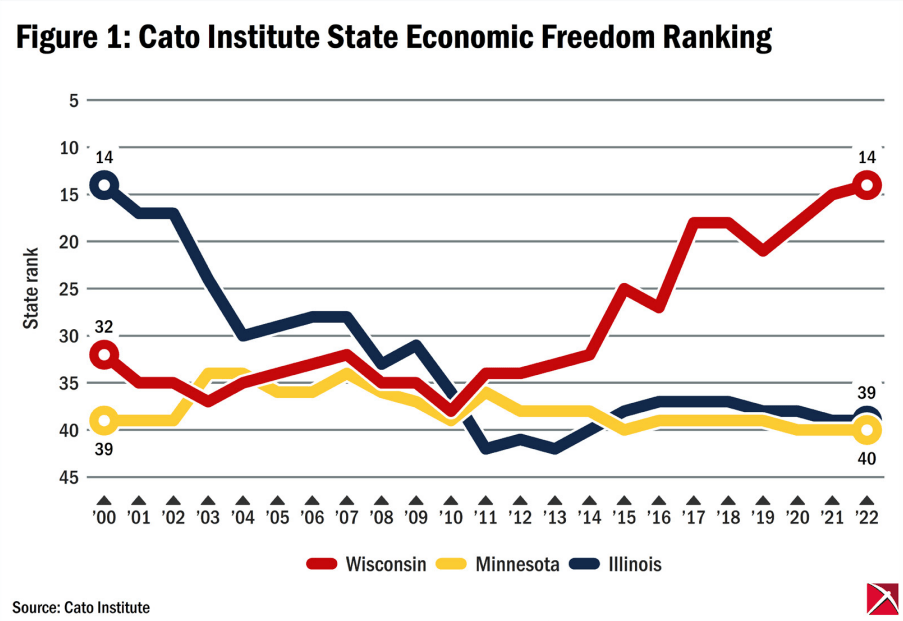
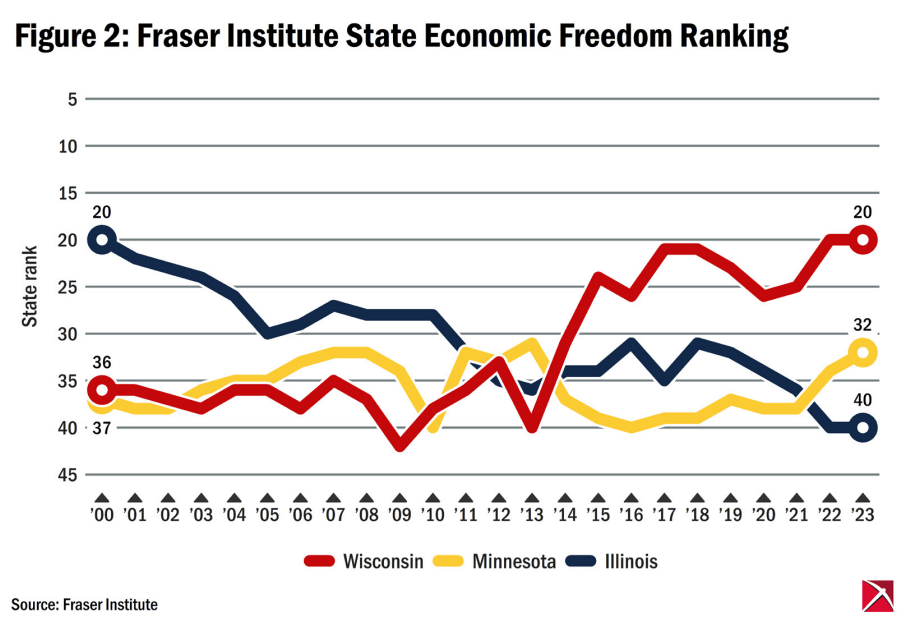
Economists have developed indices to measure economic freedom, providing a benchmark for comparisons between jurisdictions. These have been widely used in academic research. In this chapter, I use state-level economic freedom indices produced by two policy research organizations: Washington’s Cato Institute and Canada’s Fraser Institute. Figures 1 and 2 contain the economic freedom rankings of Wisconsin, Illinois and Minnesota from the year 2000 onward.6 Figure 1 contains state economic freedom rankings produced by the Cato Institute.7 Figure 2 contains state economic freedom rankings produced by the Fraser Institute.8 The Cato series extends through 2022 and the Fraser series through 2023.9 States with more market-oriented economic policies rank higher and so appear higher on the vertical axis. That is, the state with the number 1 ranking allows its residents the greatest freedom to structure their affairs as they wish; the state in 50th place allows its residents the least.
The Cato and Fraser indices consider a broad range of economic policy indicators relating to state fiscal policies (taxation and government expenditure) and regulatory policy (labor, occupational, commercial, and land use). High levels of taxation and expenditure mean that government is exercising greater control over the wealth created in society, shrinking the scope for private decision-making. States with more extensive business, occupational, labor, and land use regulations have lower levels of economic freedom than states in which individuals have greater freedom to work, contract, and use their property. The Cato economic freedom index also considers aspects of a state’s legal system and protections for private property rights.
The indices aggregate all this into a composite score. While the indices’ approaches are similar, choice of indicators and the weights assigned to each differ between the two.10 These differences allow one index or series to serve as a robustness check on the other. To the extent that the results of the two indices are similar, analysts can have greater confidence that they reflect underlying differences in the level of economic freedom in state economies.
Figures 1 and 2 clearly show that something big happened in Wisconsin starting in the early 2010s. Wisconsin had consistently ranked in or near the bottom third of states in terms of economic freedom.11 But around 2011, Wisconsin had an inflection point, afterward steadily moving up in the rankings. In 2010, Wisconsin was in 38thplace in the Cato index. By 2022, Wisconsin was in 14th place, up 24 places. Once ranked in the bottom third of U.S. states, a decade later Wisconsin was in the second quintile from the top. Wisconsin’s move was comparatively large. Only one other state, Wyoming, gained more places between 2010 and 2022 in the Cato rankings. In the Fraser index, Wisconsin moved from 38th place in 2010 to 20th place in 2023. Only two other states, Idaho and South Carolina, had larger upward moves.
Illinois and Minnesota provide a useful contrast to Wisconsin. Minnesota has consistently ranked in the bottom third of U.S. states in terms of economic freedom by both indices. While Wisconsin moved away from the progressive economic model, Minnesota continued to adhere to it. Illinois, considered one of the more open and market-oriented states in the early 2000s, has become more interventionist. Like Minnesota, Illinois is now a better exemplar of the progressive economic model than Wisconsin. Later in this chapter, I compare the growth rates of counties on opposite sides of Wisconsin’s borders with Illinois and Minnesota. Because these states have economic policies that more closely resemble the progressive ideal than Wisconsin, they form a useful basis for assessing whether the Wisconsin experiment has been successful. The use of county-level data allows me to control for the effect of intrinsic state characteristics on economic growth.
Fiscal policy in the Wisconsin experiment
Lower marginal tax rates and lower government expenditures are associated with greater economic freedom. Low marginal rates lessen the financial penalties for work, entrepreneurship and risk-taking. Lower levels of government expenditure mean that private individuals and businesses have more discretion over the use of the wealth created by their efforts and initiative.
Fiscal policies during the Wisconsin experiment included spending restraint and rate reductions for certain types of taxpayers. The tax burden, the ratio of taxes collected to economic output, is a useful measure for the size of government, indicating the share of economic resources redirected to public use.12 Table 1 contains the tax burden on Wisconsin, Illinois and Minnesota taxpayers in the years 2000, 2010 and 2022. The year immediately preceding the start of the Wisconsin experiment is 2010. The figures in Table 1 are from the Tax Foundation, a nonpartisan policy research organization in Washington.13,14 The table ends in 2022, the most recent year for which data from the Tax Foundation is available.
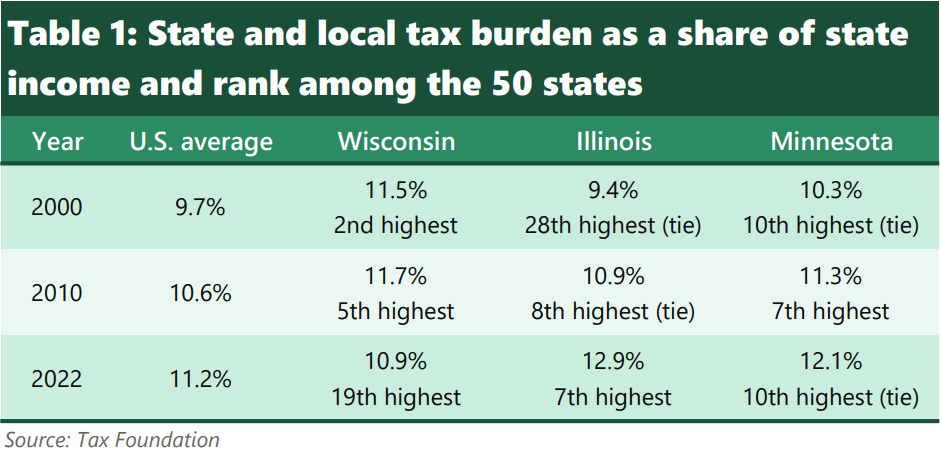
In the year 2000, the state and local tax burden in Wisconsin was the second highest in the nation. Only New York’s tax burden was higher than Wisconsin’s. Though not shown in the table, the Tax Foundation reports that Wisconsin also had the nation’s second highest tax burden in 1977, 1980 and 1990, second only to New York in each of these years.
State and local taxes in most states have consumed a growing share of economic output over the past 25 years. Wisconsin was one of the few states to defy that trend.15 The burden on Wisconsin taxpayers was lower in 2022 than in 2010 or 2000. Wisconsin was one of only nine states where the tax burden fell between 2000 and 2022 and one of 17 where the tax burden fell between 2010 and 2022. From the start of the Wisconsin experiment to 2022, the burden on Wisconsin taxpayers fell from fifth highest in the nation to 19th,a level much closer to the norm among U.S. states. The trend in Wisconsin is noticeably different than that of Illinois and Minnesota. The burden on taxpayers in those states continued to increase and is now higher than both the national average and the burden on Wisconsin taxpayers.
Wisconsin’s Act 10, enacted in 2011, was an important instrument for spending restraint. Act 10 required that most unionized state, county and municipal employees bear 50 percent of the cost of pension contributions and 12.6 percent of their health care costs. Before Act 10, governments typically covered all or most of employee health care premiums and most employees paid little or nothing toward their pensions. Shifting a portion of these costs to employees reduced the burden on taxpayers and created incentives for public sector unions and employees to seek lower health care costs.
The effect of Act 10 on state and local government budgets is significant. A 2024 report by the Wisconsin Institute for Law and Liberty pegged the aggregate savings to Wisconsin school districts in 2023 at $1.6 billion.16 An analysis published by the MacIver Institute estimates that Act 10 produced savings of $4.6 billion in 2025 alone.17 As a basis for comparison, the Wisconsin Department of Revenue estimates that Wisconsin’s total economic output in 2025 was about $473 billion.
Wisconsin has had several rounds of reductions in marginal tax rates on middle- and lower-income taxpayers. Lower marginal tax rates increase the returns to work and, thus, hours worked and labor force participation.
Wisconsin created a targeted tax credit program that reduced the effective tax rate on income derived from manufacturing and agricultural production. The manufacturing and agriculture tax credit (MAC) was enacted in 2011 and fully phased in by 2016. Wisconsin’s corporate income tax rate is 7.9 percent. The credit reduced the effective tax rate on manufacturers and agricultural concerns to 0.4 percent. Lower tax rates on business income stimulate business investment by decreasing the cost of capital. Wisconsin’s fiscal policies contrast with those of Illinois and Minnesota. Whereas Wisconsin has reduced the tax burden relative to economic output, Table 1 shows that the tax burden on Illinoisians and Minnesotans has increased. While Wisconsin’s top marginal tax rate has remained steady at 7.65 percent, Illinois and Minnesota raised their top personal tax rates. Minnesota raised its top income tax rate from 7.85 percent to 9.85 percent in 2013.18 Illinois has a flat personal income tax. Illinois increased its personal income tax rate from 3 percent to 5 percent in 2011, lowered it to 3.75 percent in 2015, and increased it again in 2017 to 4.95 percent, where it remains. Corporate tax rates in Illinois and Minnesota are higher than in Wisconsin. Minnesota’s 9.8 percent corporate tax rate, the second highest in the nation, has remained unchanged since 2010. Illinois increased its corporate income tax rate from 4.8 percent to 7 percent in 2011 and to 9.5 percent in 2017.
Labor market freedom in the Wisconsin experiment
The Wisconsin experiment included measures that increased labor market freedom. Wisconsin enacted a right-to-work law in 2015. Minnesota and Illinois are not right-to-work states. Illinois amended its constitution through a 2022 referendum to prohibit right-to-work statutes at the state and local levels.
Right-to-work laws guarantee that a worker who does not want to join a union cannot be forced to become a member and pay union dues. These laws expand economic freedom because they provide workers with greater freedom of association.19 On the other hand, right-to-work laws do not limit the ability of workers to form or join a union. Private-sector workers in all states are free to organize a labor union, to join a union, and to engage in collective bargaining. The presence or absence of a state-right-to-work law is an important consideration in the location decisions of firms in manufacturing and other capital-intensive sectors.20 Right-to-work laws reduce labor cost uncertainty and therefore, the risk that a firm will be unable to recover the large upfront costs of its initial investment. The Cato and Fraser economic freedom rankings also consider state minimum wage laws. These restrict the freedom of employers and employees to contract over wage rates. Wisconsin’s minimum wage has remained at $7.25 an hour since July 2009, the same as the federal minimum. Thirty-four states currently have a minimum wage rate that exceeds the federal rate.21 The minimum wage rate in Illinois is $15 an hour and, in Minnesota, $11.41.
Results of Wisconsin’s experiment
Did the Wisconsin experiment result in greater economic growth and prosperity? Unlike the hard sciences, economics does not lend itself to rigidly controlled experiments in a laboratory setting. Instead, economists look to so-called “natural experiments” in the real world to understand how policy changes affect economic outcomes.
The Wisconsin experiment provides unusually favorable conditions for testing whether pro-market economic reforms produce greater prosperity at the state level. In little more than a decade, Wisconsin shed much of the progressive economic model and now ranks in the upper middle among states in economic freedom. Illinois and Minnesota did not undertake such pro-market economic reforms and are examples right on Wisconsin’s doorstep of the effect of high-tax, interventionist policies. They provide a benchmark for testing the Wisconsin experiment’s results.
The Wisconsin experiment and economic growth
One of the challenges in policy analysis at the state level is differentiating between the effects of a policy change and that of inherent state characteristics on outcomes. To minimize the possibility that observed outcomes could be the result of factors unrelated to economic policy, I examine growth rates in the counties on each side of the Wisconsin-Illinois and Wisconsin-Minnesota borders.22 Separated only by a river or a surveyor’s mark, counties on each side of a state border generally have similar climate, terrain, access to transportation, settlement history and cultural characteristics. With fewer differences in inherent characteristics than entire states, examination of border counties allows for more crisp identification of the effects of policy differences.
If the Wisconsin experiment in economic freedom produced stronger economic growth than had the state had stayed with the progressive economic model, we would expect to find growth rates at least as strong in Wisconsin border counties as in counties across the border in Illinois and Minnesota. Conversely, if the Wisconsin experiment hampered Wisconsin’s economic performance, we would expect to see Wisconsin counties lagging those in adjacent states.
Tables 2 and 3 contain the growth in the dollar value of private sector economic output and output of the manufacturing sector in counties along the Illinois-Wisconsin and Minnesota-Wisconsin borders.23 Each table is divided into two subperiods. The period from 2001 to 2010 precedes the Wisconsin experiment. The second, from 2011 to 2024, is the period in which Wisconsin undertook major free-market economic reforms. In addition to the growth in the dollar value of output, the tables also include the geometric average annual growth rate during the 14 years of the Wisconsin experiment.
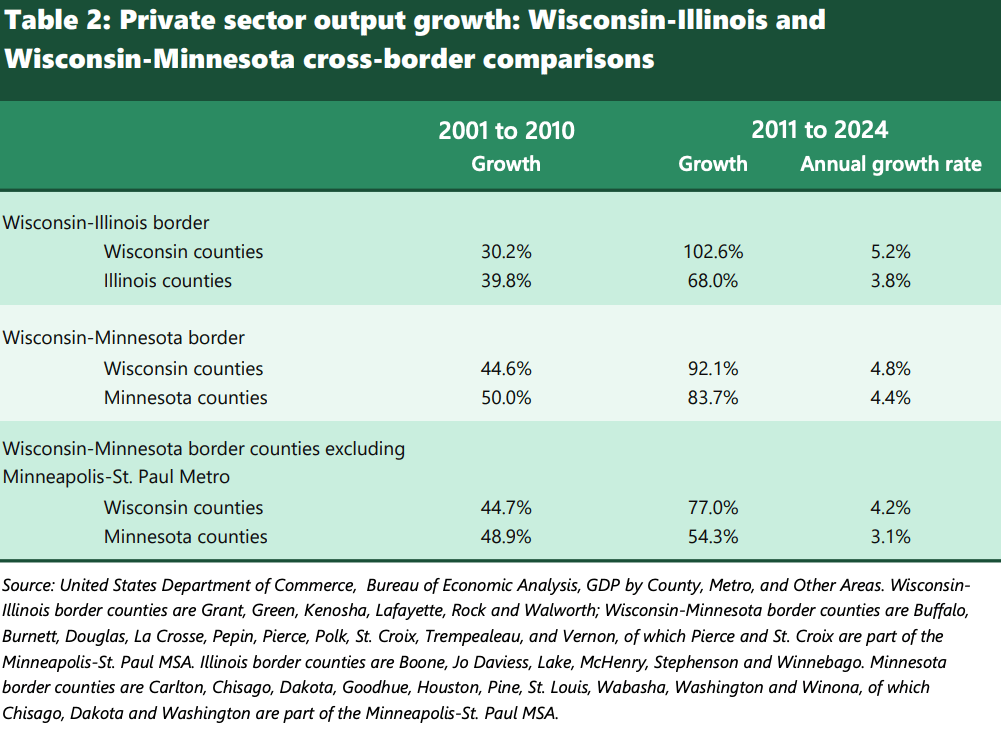
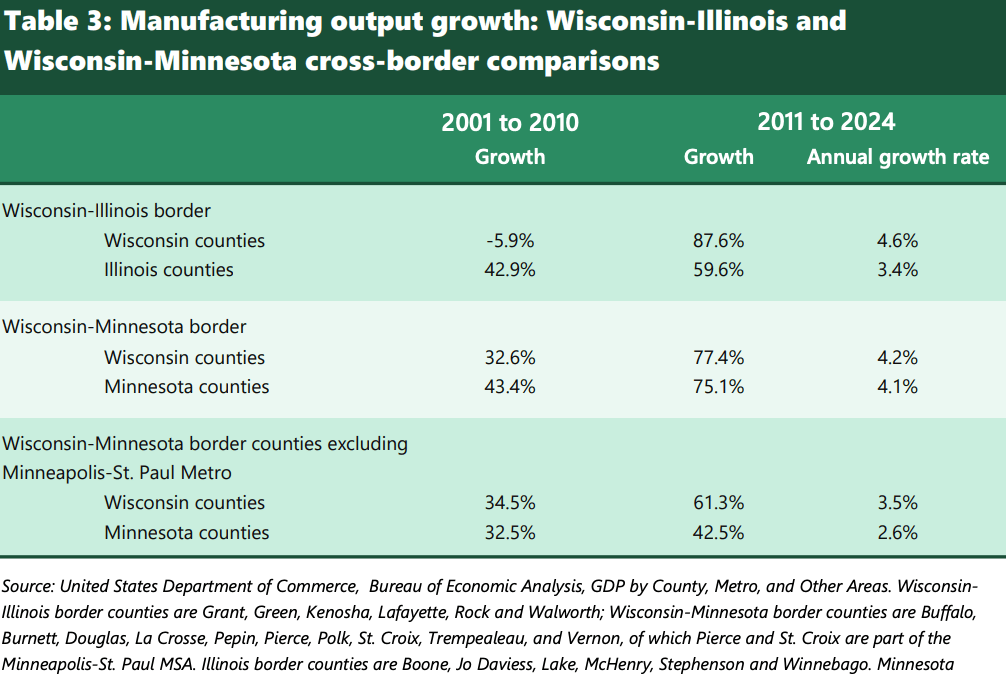
In the decade prior to the Wisconsin experiment, private sector output growth in the six Wisconsin counties on the Illinois border lagged behind those to the south. The dollar value of private sector output in the six Illinois counties grew by 39.8 percent versus 30.2 percent on the Wisconsin side. The dollar value of manufacturing output in Wisconsin’s southern border counties actually declined by 5.9 percent during the 2000s. This was due in part to the downturn in the auto industry. General Motors closed its Janesville assembly plant in 2008. Chrysler closed its Kenosha engine plant that same year.
Since the beginning of the Wisconsin experiment, economic growth on the Wisconsin side of the Illinois border has been more robust than on the Illinois side. The dollar value of private sector output in the six Wisconsin counties more than doubled since 2010 versus a 68 percent increase in the six counties on the Illinois side. In annual terms, private sector output growth on the Wisconsin side has been 1.4 percentage points faster than across the border in Illinois. Manufacturing growth has been 1.3 percentage points faster.
Values in Tables 2 and 3 are not adjusted for inflation. This allows for ease of comparison with economic reports produced by state governments, which often express output measures in nominal terms. However, because inflation rates differ little between states, let alone across state borders, the differences in annual growth rates in Tables 2 and 3 represent real as well as nominal differences in the rate of economic growth between counties on opposite sides of the border.
Economic growth in the counties on the Wisconsin side was comparable to that on the Minnesota side of the border before the Wisconsin experiment. Afterwards, economic growth on the Wisconsin side has been somewhat stronger than on the Minnesota side of the border. These differences are particularly pronounced in counties outside of the Minneapolis-St. Paul metro area. Wisconsin’s Pierce and St. Croix counties are part of that metropolitan area.24 On an annual basis, private sector and manufacturing output growth outside the metro area was a percentage point higher on the Wisconsin side than on the Minnesota side.
The results in Tables 2 and 3 suggest that the Wisconsin experiment boosted rates of economic growth. Prior to 2011, economic growth in Wisconsin’s border counties was on par with those in Minnesota and lagged that in Illinois. After 2010, economic output in Wisconsin counties that border Illinois grew more than 1 percent a year more rapidly than in the counties to the south. We see weaker evidence of superior performance among Wisconsin counties on the Minnesota border. However, there is no evidence that the Wisconsin experiment produced worse economic performance. All the evidence points in the opposite direction.
The results in this section are not surprising. Prior research shows that state-level economic freedom rankings are strongly correlated with a wide range of measures of economic vitality. States with higher levels of economic freedom have lower unemployment rates and higher labor force participation ratios,25 more rapid employment growth,26 and more startup activity,27 and they attract more foreign direct investment.28
The Wisconsin experiment and interstate migration
Interstate migration is a useful barometer of a state’s economic health. Americans have the freedom to “vote with their feet” by moving to jurisdictions that offer a more desirable mix of opportunities and amenities. Locational amenities such as climate and geography are static while public policy is not. State economic, political and fiscal policies significantly impact economic growth and job creation and can thereby alter patterns of interstate migration.
Migration patterns provide insight as to whether the Wisconsin experiment made the state more attractive to economic migrants. Illinois and Minnesota again provide useful benchmarks. If the Wisconsin experiment produced greater economic opportunity relative to the progressive model, we would expect to observe greater in-migration and less out-migration in Wisconsin relative to these two neighboring states.
Interstate migration can enhance a state’s fiscal health and economic vitality. Skilled workers relocating from other states can alleviate localized labor shortages, something particularly important in a state like Wisconsin with slow domestic labor force growth. High-income individuals of working age often possess valuable managerial, entrepreneurial and technical skills and raise the level of human capital in a state or locality. In-migration of high-income taxpayers improves a state’s fiscal balances. High-income earners generally pay more in taxes than the cost of the services that they consume.
Research on economic freedom and interstate migration shows that Americans tend to move from low- to higher-freedom states and metropolitan areas.29 A related and larger literature concerns taxes and interstate migration. Research shows that Americans tend to move from high- to low-tax states,30 that the migration propensity of higher-income households is more sensitive to tax policy than that of middle- and lower-income households,31 and that the interstate migration propensity of high-income households has become more sensitive to tax rates due to the rise of remote work arrangements following the COVID pandemic.32
I use interstate migration data from the Internal Revenue Service.33 For each state, the IRS compiles aggregate statistics on the number of returns filed by taxpayers moving into and out of that state between tax years, the number of individuals listed on the returns, and their total adjusted gross income (AGI).34 The IRS data allows for the examination of the number of movers and the economic and fiscal impact of interstate migration. IRS data on interstate migration by age and income is available from tax year 2012 through tax year 2023.35 Less granular data on interstate migration is available for earlier years.
I focus on moves by households in which the primary taxpayer is of working age (less than 65 years old). Moves by taxpayers below the age of 65 are more likely to be driven by the search for employment and entrepreneurial opportunities than moves by taxpayers of retirement age.36 Movements by working age taxpayers are of particular interest to economic development authorities. In-migration of working age individuals contributes to the size of a state’s labor force while out-migration detracts from it.
Table 4 contains the ratio of the number of individuals listed on tax returns filed by taxpayers moving into Wisconsin, Illinois or Minnesota to the number of individuals on returns filed by taxpayers leaving each of these three states. All else equal, states with better economic opportunities are expected to attract greater in-migration (the numerator of the ratio) and lose fewer individuals to out-migration (the denominator). A ratio greater than one indicates that more individuals are moving into a state than leaving; less than 1 means a state has a net loss. The entries in the first column are the prior and current tax year of the migration data in that row. The first three columns of data pertain to individuals listed on all returns, while the three columns on the right are for individuals listed on returns with an AGI of $200,000 or more.
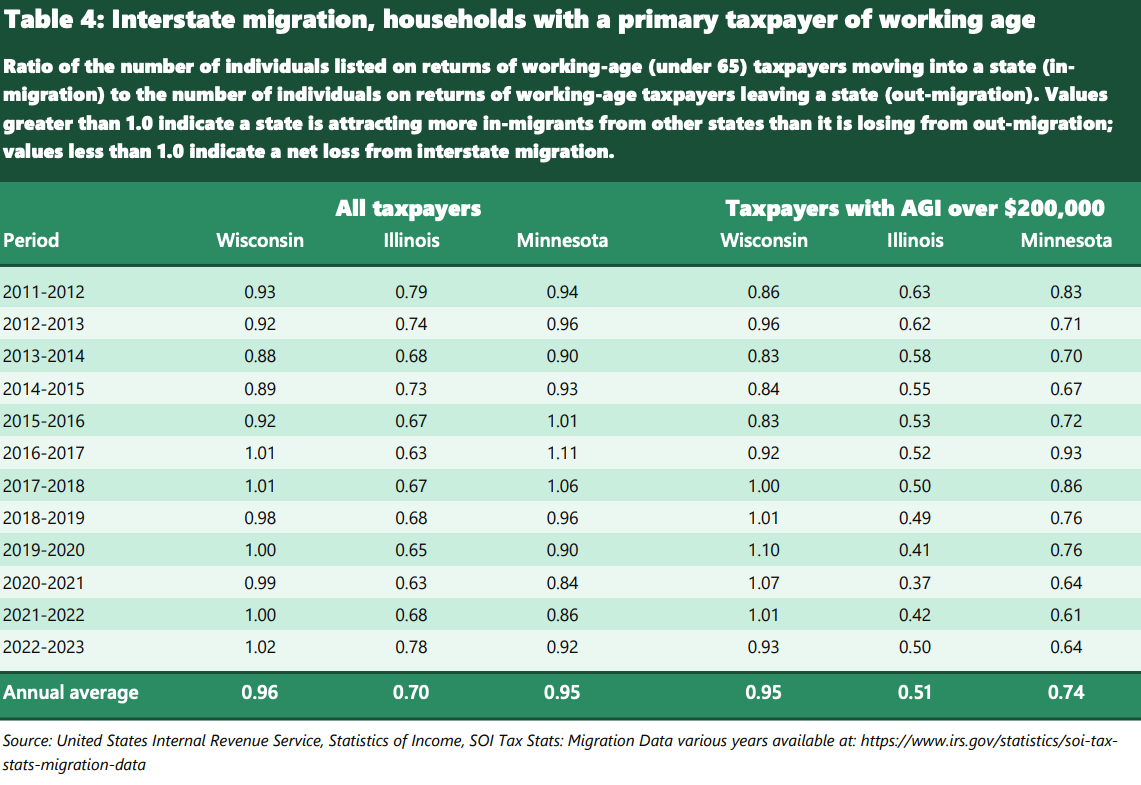
The period covered in Table 4 roughly corresponds to the Wisconsin experiment. The first column in Table 4 shows that since 2012, overall migration into and out of Wisconsin has nearly been in balance. In the average year, for every hundred individuals who moved out of Wisconsin, 96 moved in. The Wisconsin series exhibits a modest uptick at the end with annual migration ratios closer to 1 from 2017 onward.
Illinois, which transitioned from a mid-ranked state in terms of economic freedom to a low-freedom state, experienced net out-migration every year. In a typical year, for every hundred individuals leaving Illinois, just 70 move in. For the set of all tax filings, the balance of in-migrants to out-migrants in Minnesota is similar to Wisconsin.
Differences between Minnesota and Wisconsin are apparent among high-income taxpayers. Wisconsin exhibits a greater ability to attract and retain high-income taxpayers than either Illinois or Minnesota. The ratio of individuals in high-income households moving into Wisconsin to those moving out is close to one overall. In contrast, Illinois and Minnesota experience significant net out-migration of high-income earners in every year in Table 4. In a typical year, for every hundred individuals in high-income households who move out of Illinois and Minnesota, just 51 move into Illinois and 74 into Minnesota. Declines in the migration ratios for Illinois and Minnesota in later years evidences a worsening ability by these states to attract and retain high-income taxpayers, a trend not evident in the Wisconsin data. As noted earlier, academic work on migration patterns and tax rates finds that high-income earners are particularly sensitive to tax policy. Both Illinois and Minnesota have raised their top tax rate on personal and corporate income since 2010. Wisconsin has not.
The fiscal effects of interstate migration are substantial. Figure 3 contains the net change in AGI from interstate migration for Wisconsin, Illinois and Minnesota. Net change in AGI is expressed as a percentage of the aggregate AGI of all taxpayers in that state that filed a federal return in a given tax year.37 Negative values indicate that the total AGI of taxpayers who left the state between the previous and current tax year exceeds the AGI of taxpayers moving into that state.
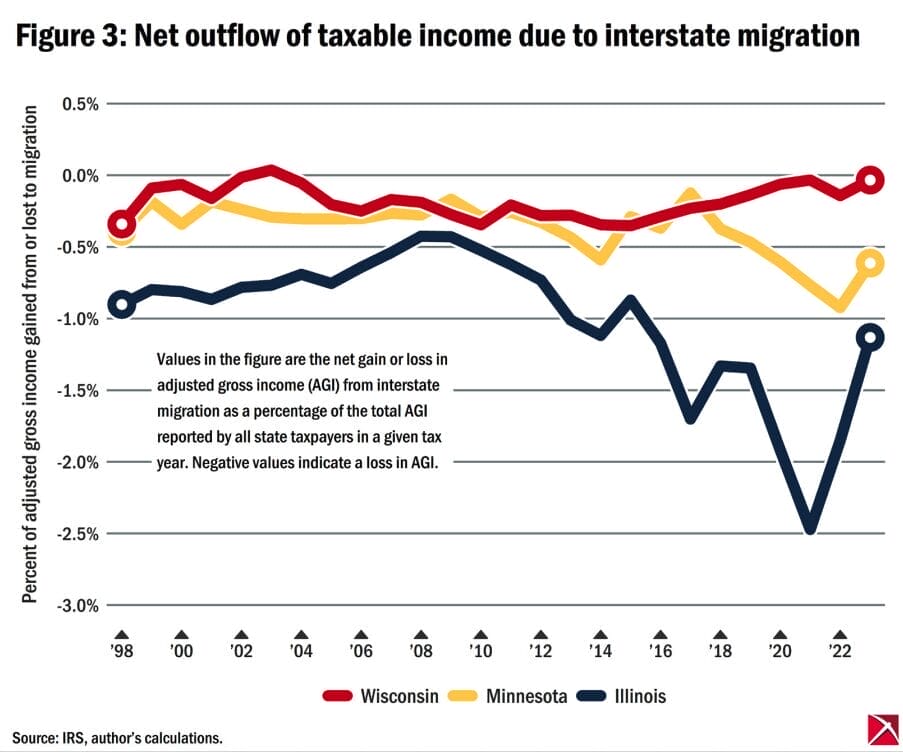
The Wisconsin series in Figure 3 does not exhibit large outflows of AGI in any year (outflows in excess of 0.5 percent of AGI of all state taxpayers), and it shows a decline in net outflows towards the end of the series. The Wisconsin series contrasts with that of Illinois and Minnesota. The fiscal drain from out-migration on Illinois AGI has intensified over time. Since 2011, Illinois has averaged a 1.3 percent annual net loss in AGI from net out-migration. The largest losses are in the most recent years. The Minnesota series also exhibits accelerating losses in AGI from out-migration in recent years. Out-migration of taxpayers with AGI over $200,000 accounts for 67 percent of Illinois’s total loss in AGI from out-migration from 2019 to 2023 and 69 percent of Minnesota’s losses.
Conclusion: A fragile experiment
Wisconsin’s experiment with economic freedom is now approximately 15 years old. However, it remains incomplete and fragile. Recent years have seen many high-profile calls to reverse course, rescind pro-market reforms, and embrace policies rooted in progressive ideology. In Wisconsin, the direction of policy is up for grabs.
Gov. Tony Evers’ 2025-2027 budget included proposals that harkened back to Wisconsin’s progressive-era policies of heavy taxation of individuals and businesses.38 His budget proposal called for a new “millionaire’s tax” of 9.8 percent on income over $1 million. Wisconsin’s current 7.65 percent top rate is already the 10th highest among U.S. states and the second highest in the Midwest. Evers’ tax proposal would set Wisconsin’s top rate at just 0.05 percentage points below Minnesota’s 9.85 percent rate and far above the top rates in Illinois (4.95 percent), Iowa (3.8 percent), Michigan (4.25 percent) and Indiana (2.95 percent). The last time that Wisconsin’s top personal tax rate was as high as Evers proposed was 1985, when the top rate was 10 percent.39
Tax increases for business are also under serious consideration. Wisconsin’s corporate income tax rate is 7.9 percent, 12th highest among states. It is one reason for the state’s 31st-place ranking in the Tax Foundation’s corporate tax competitiveness index.40 However, the manufacturing and agriculture tax credit, enacted during the first year of the Walker administration, reduces the tax rate on income derived from manufacturing and agricultural production to 0.4 percent. Evers sought in his 2023-2025 and 2025-2027 budgets to scale back the credit by limiting it to the first $300,000 in qualifying income.41 This would result in a 7.5 percentage point increase in the income tax rate on medium- and large-size manufacturing and agricultural businesses.
These tax policy changes are being considered in part to accommodate increased government spending, such as would result from a repeal of Act 10. Taken together, such tax and spending increases would be a large step toward the progressive policy model
There have also been high-profile calls to reverse recent labor market reforms, including the state’s right-to-work law. Wisconsin was a late adopter: When Wisconsin passed its law in 2015, 24 other states already had a right-to-work law.42 Shortly after its enactment, there was an attempt to overturn it in the courts, rebuffed in a 2017 decision by the Wisconsin Court of Appeals. Democratic members of the Legislature have regularly filed bills aimed at repeal, including two bills, AB470 and SB458, in the 2025-2026 session just concluded. There have been instances in which a state right-to-work law has been repealed. Most notably, in 2023 Michigan repealed its right-to-work law, which had been enacted in 2012.
Reversing the state’s move to a right-to-work framework would significantly reduce economic freedom in Wisconsin. Other labor policy changes under consideration would push the state in the same direction. Of particular importance, there have been calls from activists and politicians to more than double the state’s minimum wage to $15 per hour which, as discussed above, would reduce the freedom of employers and workers to contract over terms of employment.
These examples show that the future of Wisconsin’s experiment in economic freedom remains uncertain.
America’s federal constitution allows for states to experiment. States that find the right policy mix become more prosperous and attractive to opportunity seekers. In 2011, Wisconsin began a new policy experiment, this time an experiment in economic freedom. In little more than a decade, Wisconsin moved from one of the most interventionist states to one now ranked in the second quintile in terms of economic freedom. The evidence from border counties with Illinois and Minnesota and on interstate migration provides support for the view — consistent with decades of international and state-level evidence — that this experiment in economic freedom has promoted economic growth and prosperity for Wisconsinites.
Still, the experiment remains unfinished and the progress fragile. Lawmakers in Madison will decide in the years ahead whether Wisconsin will return to the progressive government-oriented approach or continue our state’s experiment in economic freedom.
James Bohn is an economist with over 30 years of experience in government, business and academics. Most recently, he served as an assistant vice president and senior professional with the Federal Reserve Bank of Boston. Bohn holds a doctorate in business economics from Harvard University and is a CFA charterholder. He resides in the Milwaukee area.
Any use or reproduction of Badger Institute articles or photographs requires prior written permission. To request permission to post articles on a website or print copies for distribution, contact Badger Institute Marketing Director Matt Erdman at matt@badgerinstitute.org.
Submit a comment
1 U.S. Supreme Court Justice Louis Brandeis wrote in New State Ice that “a single courageous State may, if its citizens choose, serve as a laboratory; and try novel social and economic experiments without risk to the rest of the country.” New State Ice Co. v. Liebmann, 285 U.S. 262 (1932).
2 Thomas Leonard, Illiberal Reformers: Race Eugenics and American Economics in the Progressive Era. (Princeton, NJ: Princeton University Press, 2016), 9, 56.
3 Thomas Leonard, “American Economic Reform in the Progressive Era: Its Foundational Beliefs and Their Relation to Eugenics,” History of Political Economy, 41, no. 1 (2006): 109-141.
4 J. David Hoeveler, John Bascom and the Origins of the Wisconsin Idea (Madison, WI: University of Wisconsin Press, 2016).
5 “The Progressive Era: 1895-1925,” Wisconsin Historical Society, https://www.wisconsinhistory.org/Records/Article/CS3588 (accessed March 22, 2026); H. Russell Austin, The Wisconsin Story: The Building of a Vanguard State (Milwaukee, WI: The Milwaukee Journal, 1958) 253-254.
6 There is a lag between the date that data is collected and the publication of the indices. That is why the most recent year for which data is available is 2023.
7 “Freedom in the 50 States,” Cato Institute, accessed March 22, 2026, https://www.freedominthe50states.org/; William P. Ruger and Jason Sorens, Freedom in the 50 States: An Index of Personal and Economic Freedom, Sixth edition (Washington, DC: Cato Institute, 2021).
8 Dean Stansel, Jose Torra, Matthew D. Mitchell and Angel Carrion-Tavarez, Economic Freedom of North America 2025, (Vancouver, BC: Fraser Institute, 2025).
9 Index values refer to the state of economic freedom as of two to three years in the past due to reporting lags by statistical agencies and the large amount of data necessary to construct these indices.
10 The Fraser index considers a smaller set of factors than the Cato index. Fraser’s index is more heavily weighted toward quantitative measures such as the ratio of tax receipts to state personal income whereas the Cato index utilizes a large set of discrete measures based on the existence or absence of particular state and local statutory requirements.
11 The Fraser Institute’s economic freedom index extends back to 1981. Wisconsin’s average rank between 1981 and 1999 was 40 with a high of 32 in 1982 and a low of 47 in 1987. In 1987, only Alaska, New York and West Virginia were ranked below Wisconsin in terms of economic freedom.
12 The tax burden does not capture the full cost of government intervention. It does not include the cost of regulation or government seizure of property. The tax burden also does not account for deficit financing. However, the tax burden remains a widely used measure for the cost of state and local governments, which have a more limited ability to borrow than the federal government.
13 Erica York and Jared Walczak, “State and Local Tax Burdens, Calendar Year 2022,” Tax Foundation, April 7, 2022 https://taxfoundation.org/data/all/state/tax-burden-by-state-2022/.
14 The denominator in the Tax Foundation’s calculation of tax burden is a state’s share of the net national product of the United States. Net national product is that value of all goods and services used minus depreciation of capital goods.
15 The findings of the Wisconsin Policy Forum on trends in the state and local tax burden in Wisconsin and other states are qualitatively similar to those of the Tax Foundation. The Wisconsin Policy Forum did not produce estimates of the tax burden in 2010. Since 2010 is near the beginning of Wisconsin’s experiment on economic freedom, Table 1 utilizes data from the Tax Foundation. The Forum finds an even larger drop in the Wisconsin tax burden between 2000 (12.47 percent, third highest among the states) and 2022 (9.87 percent, 35th highest). The Forum reports a modest decline during that time in the tax burden in Minnesota between 2000 (12.3 percent, tie for fifth highest) and 2022 (11.9 percent, tie for eleventh highest) and a substantial increase in the tax burden in Illinois (10.5 percent in 2000 to 12.2 percent, tied for ninth highest in 2022). “State Tax Ranking Hits All-Time Low,” Wisconsin Policy Forum, November 2024, https://wispolicyforum.org/research/state-tax-ranking-hits-all-time-low/.
16 Will Flanders, “Back to the Past: The Fiscal Threat of Reversing Act 10 in Public Education,” Wisconsin Institute for Law and Liberty, April 2024, https://will-law.org/wp-content/uploads/2024/04/Act-10-Final-Report.pdf.
17 William Osmulski, “Act 10 Savings Top $35 Billion in 2025,” MacIver Institute for Public Policy, March 17, 2025, https://www.maciverinstitute.com/research/act-10-savings-top-35-billion-in-2025.
18 “Minnesota Historical Tax Rates,” Minnesota Department of Revenue, accessed March 22, 2026, https://www.revenue.state.mn.us/minnesota-historical-tax-rates.
19 Ruger and Sorens, 47, Stansel et al., 22.
20 Thomas J. Holmes, “The Effect of State Policies on the Location of Manufacturing: Evidence from State Borders,” Journal of Political Economy, 106 no. 4 (1998): 667-705
21 “State Minimum Wages,” National Conference of State Legislatures, updated January 5, 2026 https://www.ncsl.org/labor-and-employment/state-minimum-wages.
22 Wisconsin also borders Iowa and Michigan. Iowa and Michigan are closer to the middle of the distribution of the states in the Cato and Fraser rankings. Therefore, comparisons with Iowa and Michigan would provide little insight on differences in performance between the free-market and progressive economic models. There is also greater economic activity along Wisconsin’s borders with Illinois and Minnesota as compared to the Iowa and Michigan borders.
23 Data is drawn from the Bureau of Economic Analysis, a statistical agency within the United States Department of Commerce.
24 The Census Bureau does not consider Kenosha County as part of the Chicago Metropolitan Statistical Area. Kenosha county is part of the Chicago Combined Statistical Area.
25 Lauren Heller and E. Frank Stephenson, “Economic Freedom and Labor Market Conditions: Evidence from the States,” Contemporary Economic Policy 32, no. 1, (2014): 56-66; Daniel Bennett, “Subnational Economic Freedom and Performance in the United States and Canada,” Cato Journal 36, no. 1 (2016): 165-185.
26 Thomas A. Garrett and Russell M. Rhine, “Economic Freedom and Employment Growth in U.S. States,” Federal Reserve Bank of St. Louis Review 93, no. 1 (2011): 1-18; Matthew D. Mitchell, The Liberators: US States That Increased their Economic Freedom in the 21st Century, 2025, Fraser Institute.
27 Shishir Shakya and Alicia Plemmons, “The Impact of Economic Freedom on Startups,” Journal of Regional Analysis and Policy 51, no. 1 (2021): 29-42.
28 Dennis Pearson, Dong Nyonna and Kil-Joong Kim, “The Relationship between Economic Freedom, State Growth and Foreign Direct Investment in US States,” International Journal of Economics and Finance 4, no. 10, pp. (2012): 140-146.
29 Imran Arif, Adam Hoffer, Dean Stansel, and Donald Lancombe, “Economic Freedom and Migration: A Metro Area-level Analysis,” Southern Economic Journal 87, no. 1, (2020): 170-190; J. Matthew Shumway, Economic Freedom, “Migration and Income Change among U.S. Metropolitan Areas,” Current Urban Studies 6, no. 1, (2018): 1-20; Nathan J. Ashby, “Economic Freedom and Migration Flows Between U.S. States,” Southern Economic Journal 73, no. 3 (2007): 677-697.
30 Andrey Yushkov, “Taxes and Migration: New Evidence from Academic Research, Tax Foundation,” March 12, 2024 https://taxfoundation.org/blog/taxes-state-outmigration-academic-research/; Andrew Mikula, “Tax Flight of the Wealthy: An Academic Literature Review, Pioneer Institute for Public Policy Research,” June 2021, https://pioneerinstitute.org/tax-flight-of-the-wealthy-an-academic-literature-review/; Andrey Yushkov, “Taxes and Interstate Migration: 2024 Update, Tax Foundation,” September 3, 2024, https://taxfoundation.org/data/all/state/taxes-affect-state-migration-trends-2024/.
31 Traviss Cassidy, Mark Dincecco and Ugo Antonio Troiano, “The Introduction of the Income Tax, Fiscal Capacity, and Migration: Evidence from US States,” American Economic Journal: Economic Policy 16, no.1 (2024): 359-393; Enrico Moretti and Daniel J. Wilson, “The Effect of State Taxes on the Geographical Location of Top Earners: Evidence from Star Scientists,” American Economic Review 107, no. 7 (2017): 1858-1903.
32 Mert Akan, Jose Maria Barrero, Nicholas Bloom, Thomas Bowen, Shelby R. Buckman, Steven J. Davis and Hyoseul Kim, “The New Geography of Labor Markets,” NBER Working Paper 33582, November 2025.
33 The data is compiled by the IRS’ Statistics of Income program. The data is based on all returns filed through late September of each tax year. The IRS estimates that their computations include between 95 and 98 percent of all returns filed in a given tax year. Due to the complexity of processing such a large amount of data, migration statistics are reported with a two- to three-year lag. The data does not account for low-income individuals who are not required to file a federal tax return.
34 Before 2018, the IRS reported the number of exemptions claimed by taxpayers moving into and out of each state. Personal exemptions were eliminated beginning in 2018. Federal tax returns from 2018 onward list individuals claimed as dependents.
35 Returns are assigned to age buckets based on the age of the primary taxpayer listed on the return.
36 Since returns filed by working age taxpayers often include a spouse and children, the number of exemptions claimed better reflects the number of working age persons moving into and out of a state. I repeat the analysis using the number of returns filed. The result using the number of returns was not materially different than that using the number of exemptions.
37 Data in Figure 3 comes from a different report produced by the IRS that includes earlier data on interstate migration but does not have the granularity of the report used to produce Table 4.
38 State of Wisconsin Department of Administration, “Budget in Brief, 2025-2027,” February 2025, 102.
39 “Wisconsin Individual Income Tax,” Wisconsin Department of Revenue, accessed March 22, 2026, https://docs.legis.wisconsin.gov/misc/lc/study/2012/symposia_series_on_state_income_tax_reform_information/020_july_25_2012_meeting/july25koskinen
40 Illinois ranks 42nd in corporate tax competitiveness; Minnesota ranks 43rd. Janelle Fritts, Jared Walczak, Abir Mandal, and Katherine Loughead, “2026 State Tax Competitiveness Index,” Tax Foundation, October 30, 2025, https://taxfoundation.org/research/all/state/2026-state-tax-competitiveness-index/.
41 State of Wisconsin Department of Administration, “Budget in Brief: 2023-2025,” February 2023, 92-95; State of Wisconsin Department of Administration, “Budget in Brief: 2025-2027,” February 2025, 103.
42 Ohio also has a limited right-to-work law that allows employees covered by a collective bargaining agreement to opt out and pay a reduced rate of union dues.