In her State of the State speech, Gov. Gretchen Whitmer listed increased use of wind and solar power as one of her accomplishments. Wind power grew to provide 10% of electricity generated in Michigan, and solar’s share grew to 3%. But is this something to brag about? Michigan and its four neighboring states — Illinois, Indiana, Ohio and Wisconsin — all added wind and solar power since 2019, and all saw electricity prices rise, according to the Energy Information Agency Electric Power Monthly.
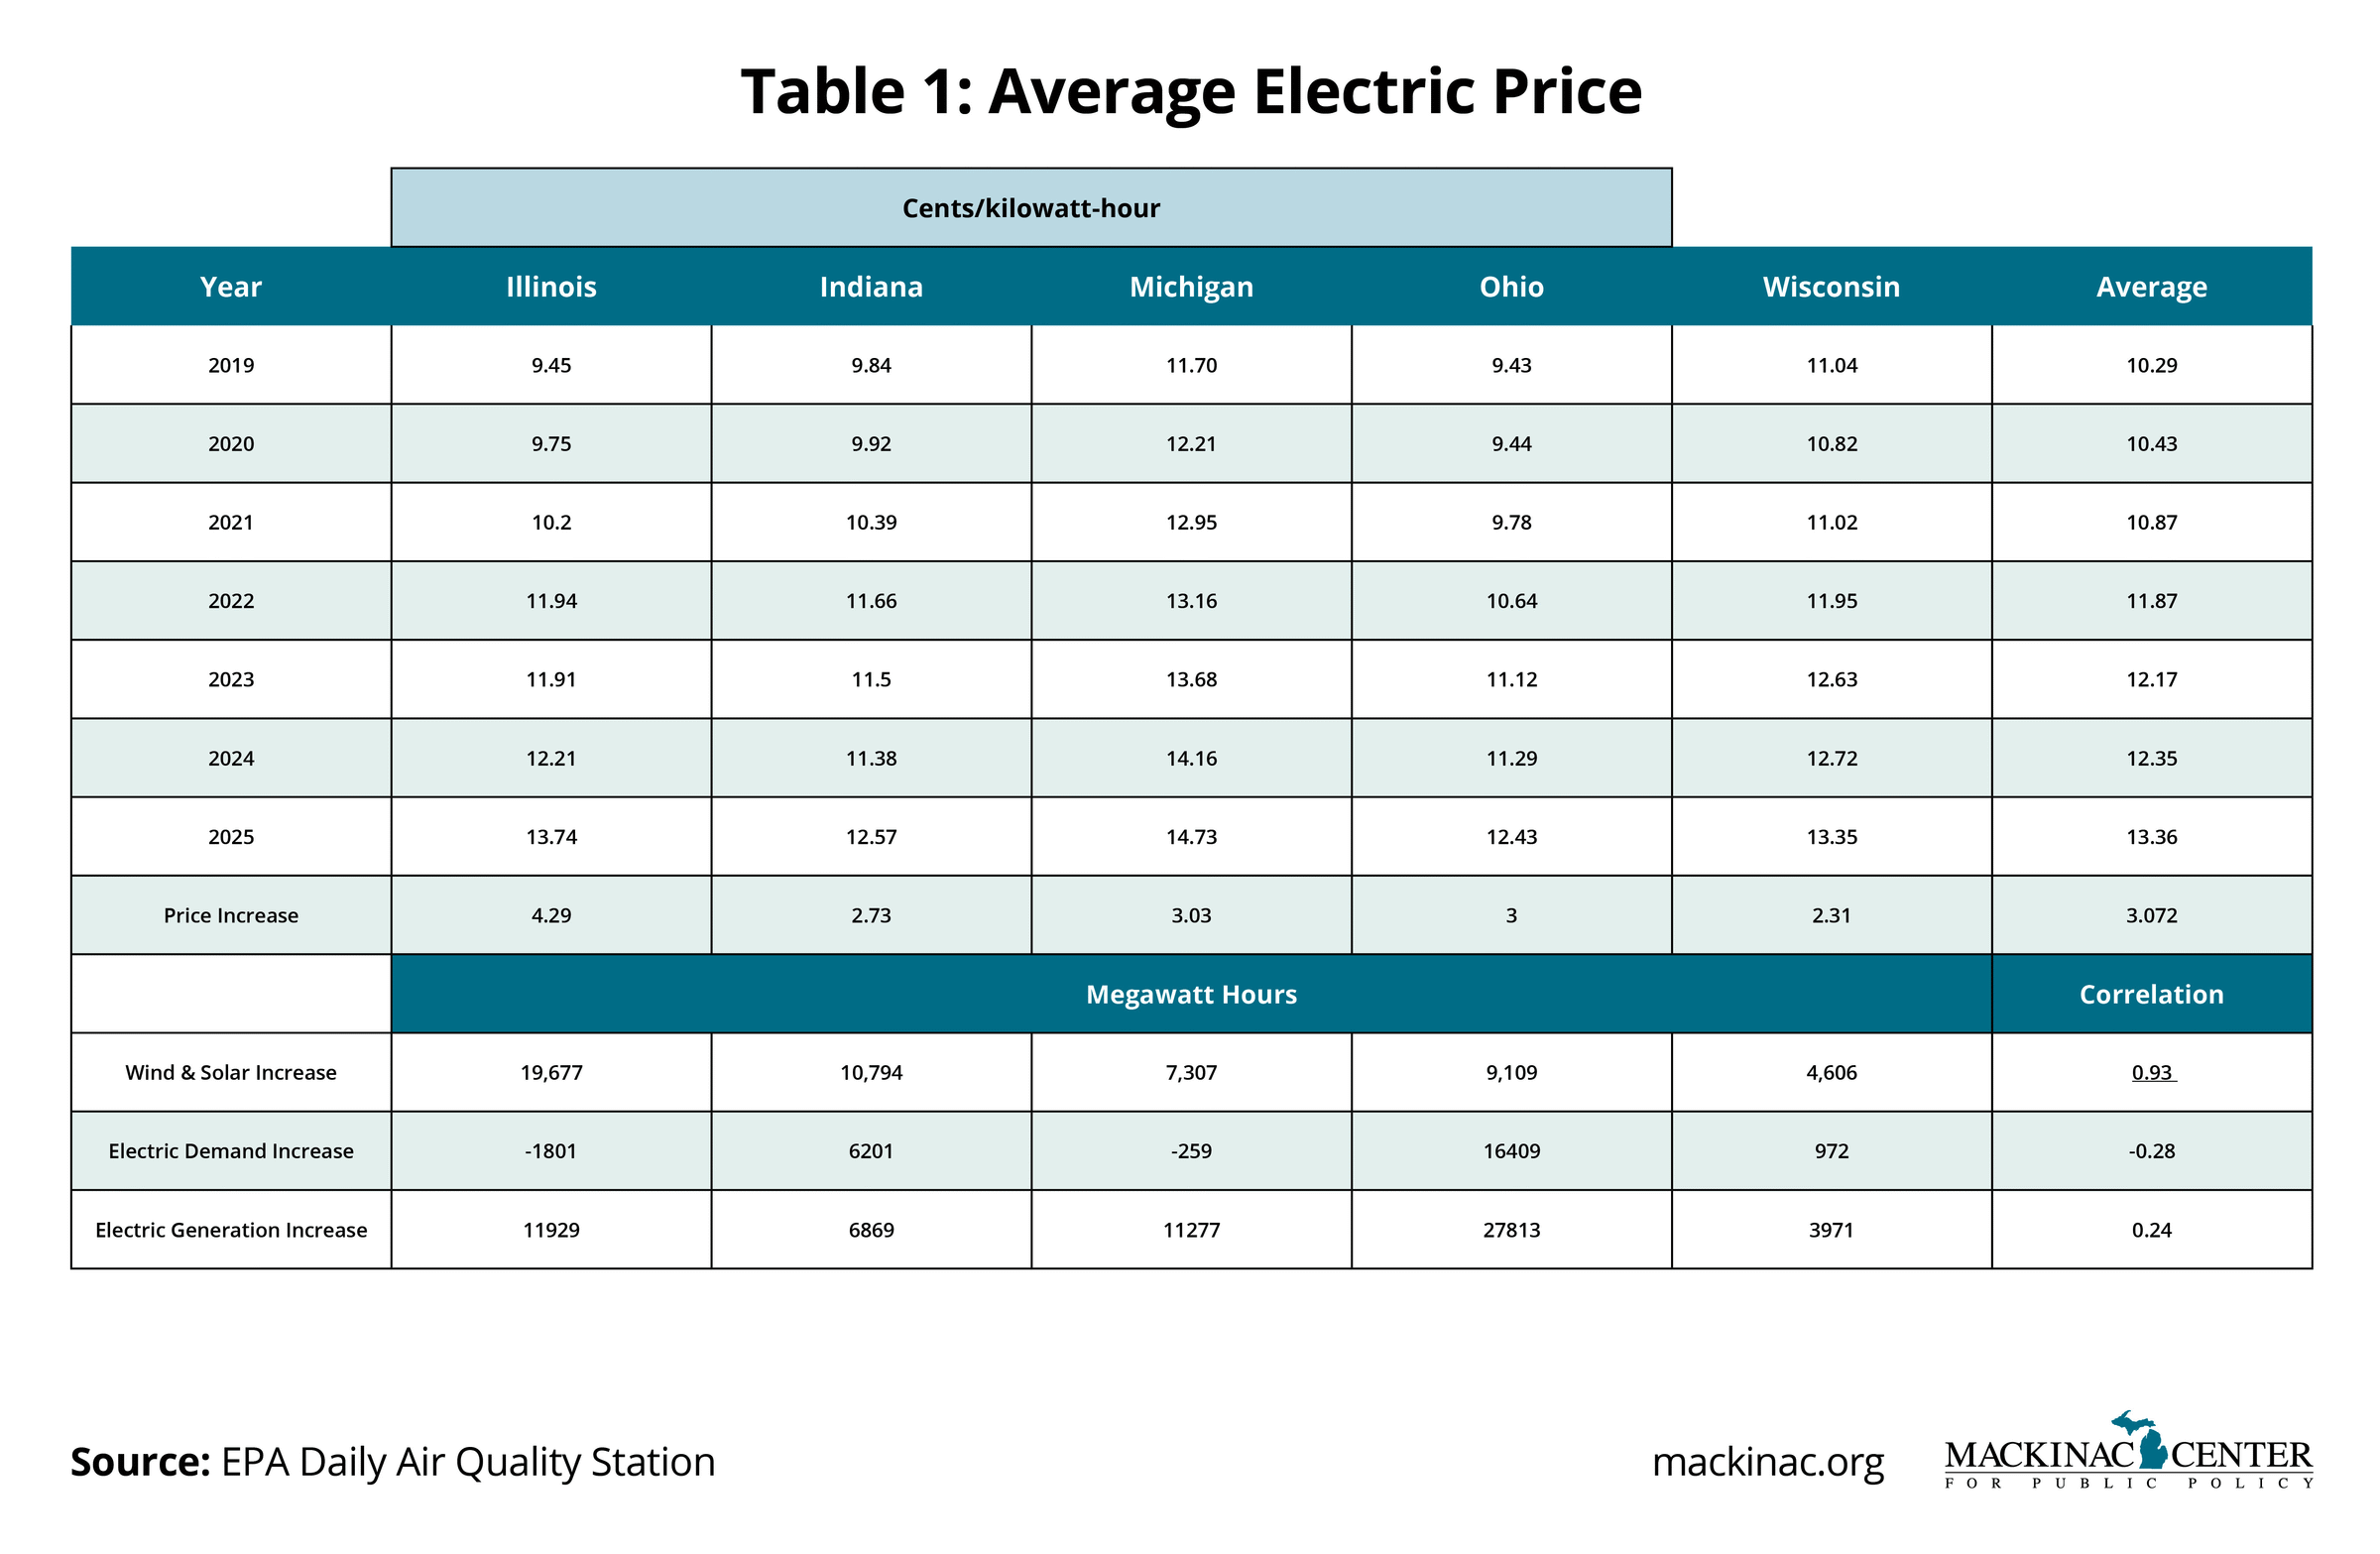
Table 1 below shows how each state fared. There is a strong correlation (0.93, compared to a perfect correction of 1.0) between how much wind and solar power was added in each state and how much electricity prices rose. Renewable energy proponents often tie electric price increases to rising demand or changes in how utilities generate electricity. This comparison shows little correlation between rising electric prices and changes in electric demand or generation for these five Midwest states.
Michigan electric prices are likely to continue rising. State law requires that wind and solar power provide 60% of all electricity generated in Michigan by 2035. The Mackinac Center’s study, “Michigan’s Expensive Net-Zero Gamble,” estimates residential electricity rates could rise by about $2,000 a year by 2035 as a result.
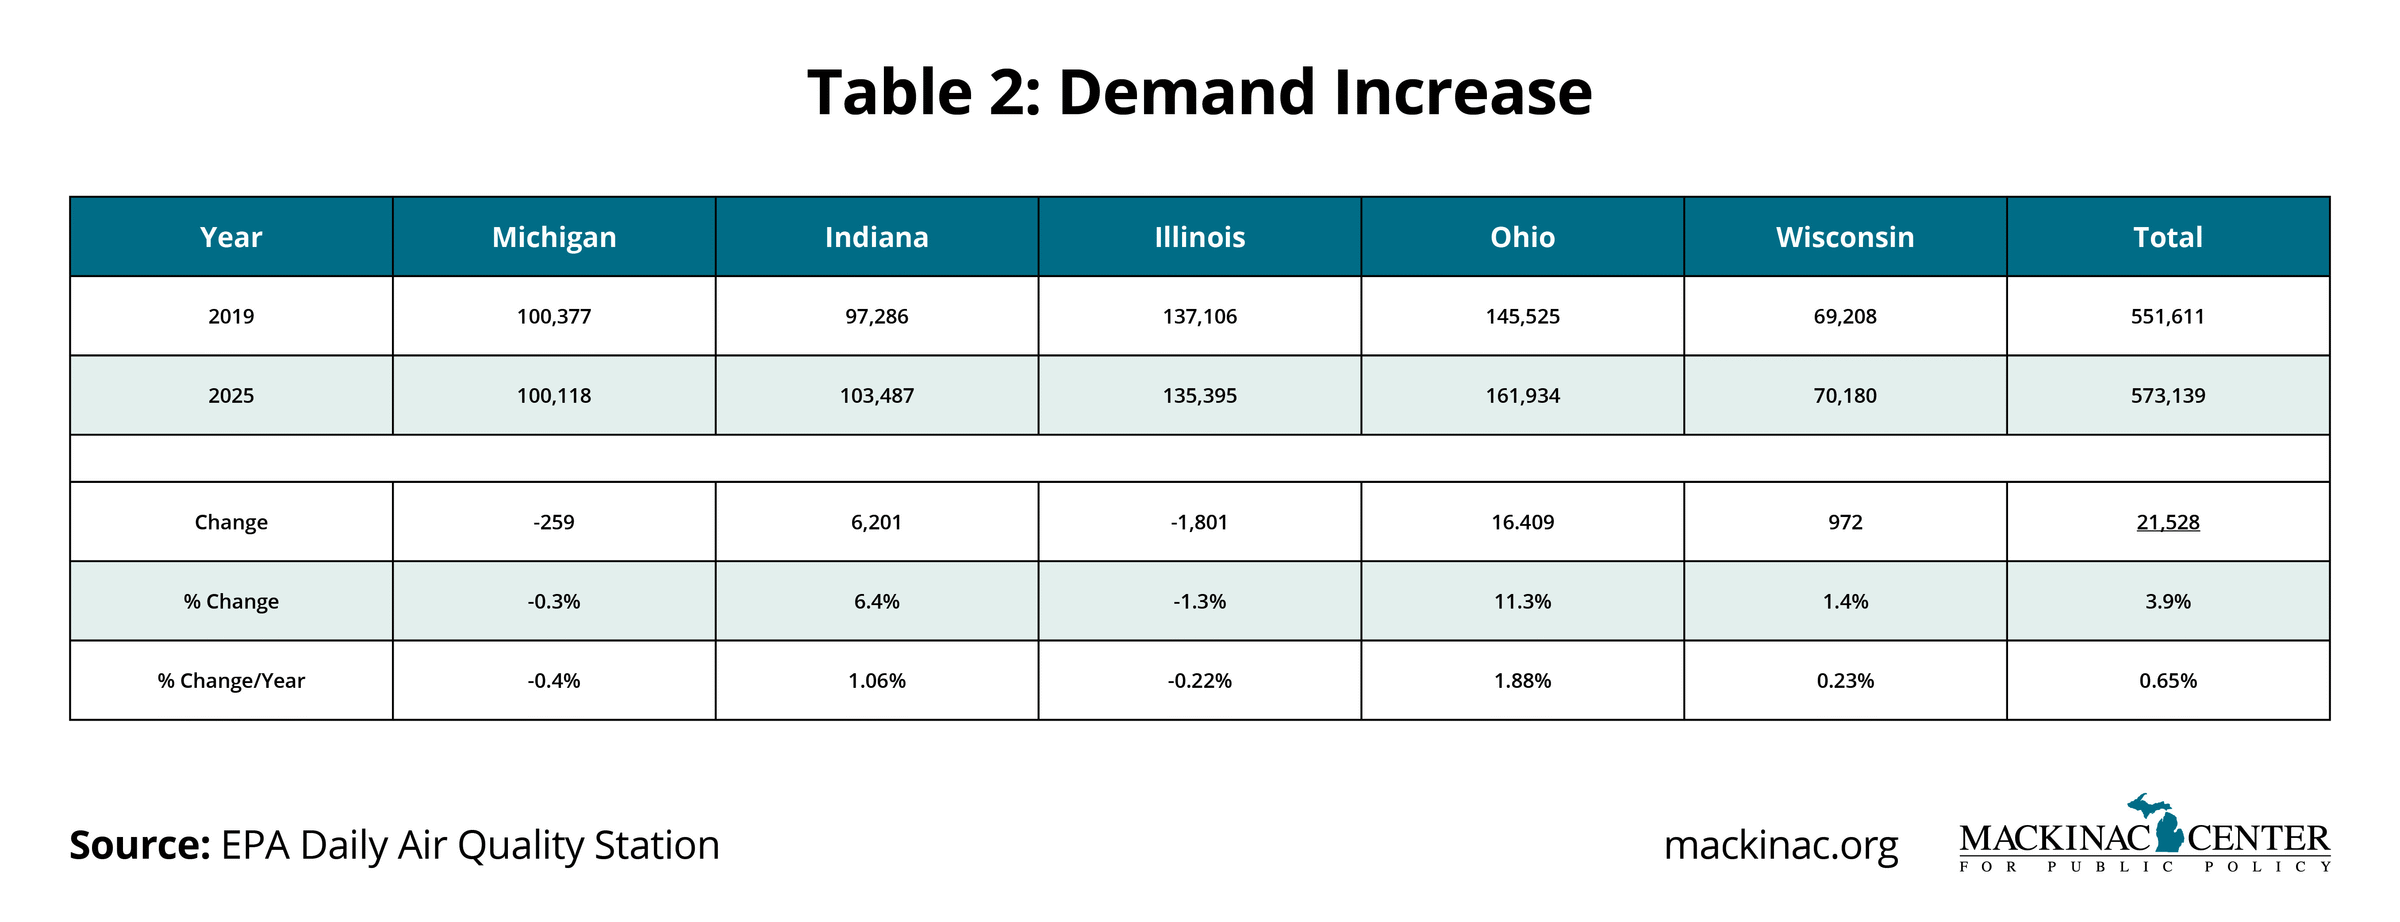
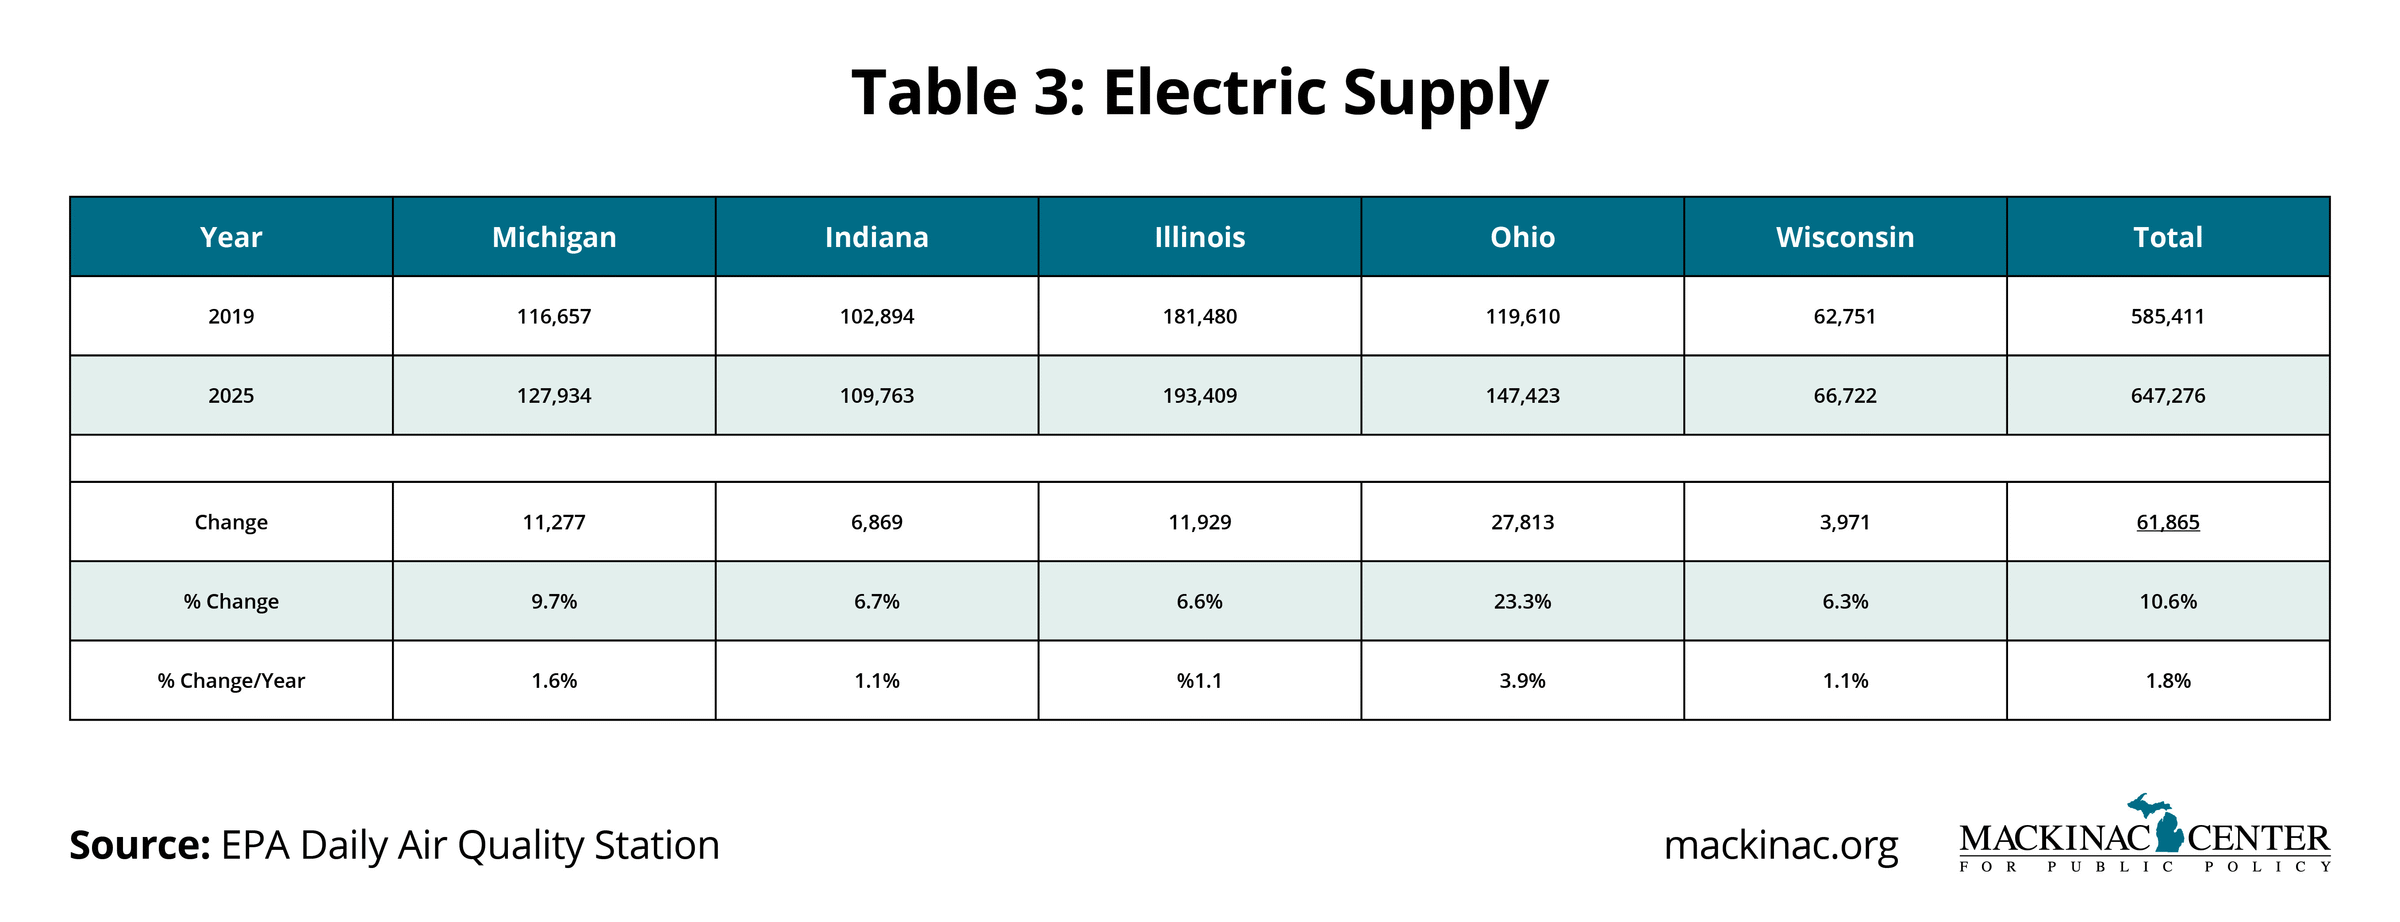
The debate over what is causing electric rates to rise comes down to a few choices. If demand rises faster than supply, it is a basic economic principle that prices will rise. But demand for electricity has risen less than 1% a year for decades. We are, though, beginning to see increased demand with the rise of data centers, electric vehicles, and some state regulations encouraging a switch from natural gas and propane appliances to electric (electrification). These changes will continue to increase demand for electricity in Michigan. The total amount of electricity demanded by the five states has increased 0.65% per year, as seen in Table 2. This correlates with rising electricity rates of only 0.28.
If supply had fallen below demand, prices would have risen. But in the five states, the amount of electricity generated increased by 1.8% each year. Supply exceeded demand by 13%, an amount that closely meets the amount required by the regional power grid as a reserve. It is significant that added wind and solar power accounts for 83% of the supply increase.
It is also possible for prices to rise even if demand and supply generally stay in balance. Power plants are changing their mix of fuels by replacing coal, which requires a significant amount of physical labor, with lower-cost natural gas. Natural gas prices have been stable, though they increased from $2.40 per one million British Thermal Units in 2019 to $3.20 in 2025. That would only increase electricity rates by about 0.2 to 0.4 cents per kilowatt-hour. The five-state average electric price increased more than 3 cents, so something else must be at work.
Regulated utilities ask the Michigan Public Service Commission for higher rates to pay for maintaining and upgrading their infrastructure. Between 2019 and 2025, Consumers Energy’s electricity rates rose 6.8% and DTE’s rose 8.4%, with regulators’ blessing. The increases fund upgrades needed to keep aging electric grid reliable.
The cost of individual wind and solar projects is not covered in the documents utilities file with state regulators. Each wind or solar project goes before regulators, and utilities must show the project is consistent with their Integrated Resource Plans. The regulator last approved that forecast in 2022. Both utilities were approved to spend $11 billion over the next 20 years on wind, solar, and batteries. The equipment cost of each project is typically funded like a 15-year mortgage. Each utility can also make a 9% profit, with the cost silently added to electric bills.
Michigan’s average electricity rate rose 26% from 2019 to 2020 when the hidden cost of added wind, solar, and batteries are included. Numbers from the Energy Information Agency from February 2020 and February 2026 show that residential rates rose 27%, while commercial rates rose 20% and industrial rates rose 18%.
The correlation between the electricity rate increase combined with our detailed causation review suggests that about 70% of the price increase since 2019 was caused by the state government’s requirement to use more wind and solar power.