
- Critics of the Opportunity Scholarship Program (OSP) assert that the program siphons funds from schools and hinders the state’s ability to fund public schools adequately
- Counter to their assertions, real per-pupil spending for public schools has increased by 9.5 percent over the first 10 years of the program, after having decreased by 4.5 percent in the 10 years prior to the OSP
- Despite its growth, OSP expenditures in 2024-25 were still just 2.4 percent the size of K–12 expenditures
North Carolina’s Opportunity Scholarship Program (OSP) has completed its first decade of operation. The program continues to attract growing numbers of students seeking greater educational options. It also continues to attract critics making the same old assertions that the program takes money away from traditional public schools and impairs the government’s ability to fund public education.
Gov. Josh Stein’s office, for example, called Opportunity Scholarships a “scheme” and said that they “siphon” millions of dollars in state funding from public schools. Rep. Justin Rubin (D-Wake) said that the Opportunity Scholarships “have stripped money out of our rural public schools.” The North Carolina Justice Center said that they “drain money from and exacerbate budget pressures on our already-underfunded inclusive public schools.”
Are those claims true, or are they merely overheated rhetoric?
To test those claims, this brief reviews general enrollment and spending trends before and after the creation of the OSP. Those data are readily available at both the state and local school district levels. The focus here is on state-level aggregate data and the 10-year periods before and after the OSP started operation. The K–12 public school data used here include traditional public schools but not charter schools.
Enrollment trends
Because, funding is tied to the number of students, it is important to understand changes in overall K–12 enrollment in the last 20 years. Chart 1 lists Average Daily Membership (ADM) enrollment in North Carolina public schools from 2004–05 to 2024–25. ADM measures official enrollment, not attendance, and provides a better and more stable number for school budgets.
Chart 1
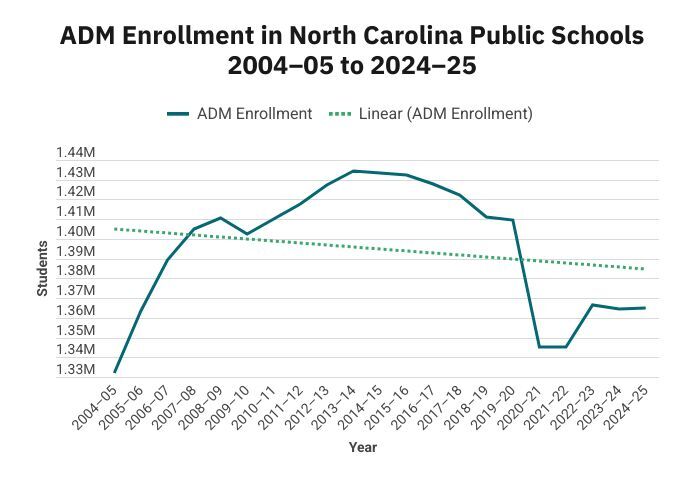
The chart shows increasing enrollment from 2004–05 to 2013–14 followed by a leveling off and decline, settling to around the same level in 2024–25 as in 2005–06. From 2004–05 to 2013–14, enrollment increased by 7.6 percent, or by over 102,000 students, but that growth didn’t last. From 2014–15 to 2024–25, including the Covid-19 years, enrollment fell by 4.7 percent, or about 68,500 students. At the end of the 20-year period, enrollment in North Carolina public schools was up only by 2.4 percent, or about 33,100 students.
Spending trends
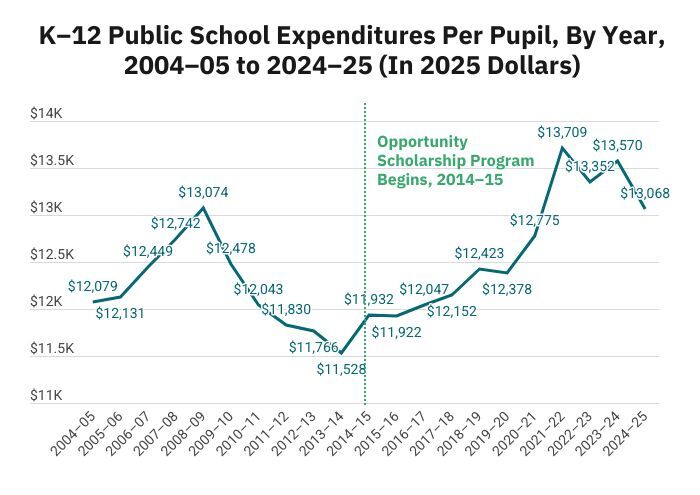
Another way to examine the impact of the Opportunity Scholarship Program on education spending is to look at per-pupil spending before and after the introduction of the program in the 2014–15 school year. Chart 2 shows the change in real total per-pupil spending for students from Fiscal Year (FY) 2005 to FY 2025. Annual figures include state, federal, and local spending and is adjusted for inflation. Over the entire 20-year period, real per-pupil expenditures increased about 8.2 percent, or on average, a little less than one-half of one percent (0.39) per year over the period.
Chart 2
Source: North Carolina Public Schools Statistical Profile; author’s calculations
Prior to the introduction of the Opportunity Scholarship Program, real per-pupil spending had declined by 4.5 percent from year 2004-05 to 2013-14. After the program was introduced and began to grow, however, real per-pupil spending in North Carolina public schools increased by 9.5 percent.
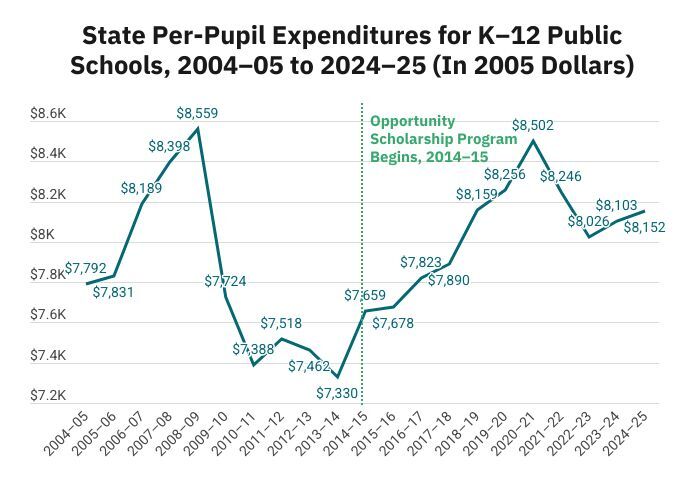
What about just state per-pupil spending, not including federal and local spending? Critics of the OSP assert that the program has contributed to a decline in state spending, which accounts for approximately two-thirds of local school district budgets. Chart 3 looks at real state per-pupil funding (adjusted for inflation) for K–12 public school students in North Carolina from 2004-05 to 2024-25.
Chart 3
Source: North Carolina Public Schools Statistical Profile; author’s calculations
From 2004–05 to 2013–14, before the Opportunity Scholarship Program began, overall real state per-pupil expenditures declined by 5.9 percent. After the program started in 2014–15, real state per-pupil expenditures increased by 6.4 percent. Over the 20-year period, real state per-pupil expenditures increased by 4.6 percent.
Opportunity Scholarships and K–12 spending
Finally, one last way to evaluate the impact of the Opportunity Scholarship Program on spending for K–12 education is to measure the size and relative growth of each program.
Chart 4
Sources: North Carolina Public Schools Statistical Profile; North Carolina State Education Assistance Authority; author’s calculations
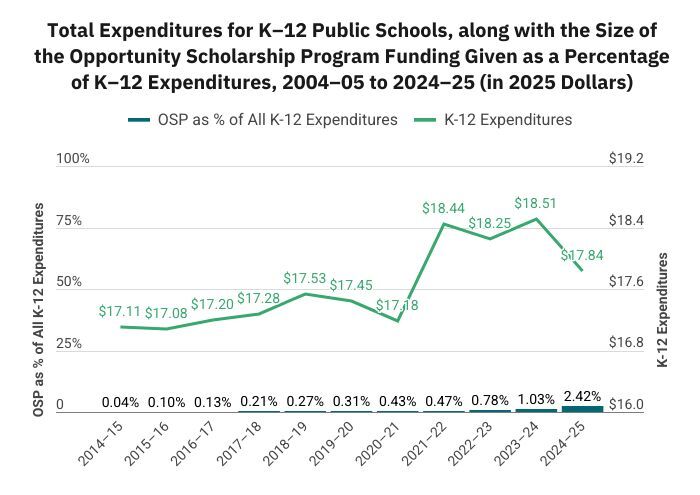
Chart 4 tracks the total change in real K–12 expenditures with the relative size of the Opportunity Scholarship Program, which is expressed as a percentage of real total K–12 expenditures.[i]
The program grew dramatically, from approximately $6 million in its first year to over $432 million in 2024–25, but even so, real total spending for K–12 public education North Carolina was also increasing. According to the numbers, real K–12 spending over the period increased by $734 million, from $17.1 billion to $17.8 billion, about 4.3 percent. In comparison, spending on the Opportunity Scholarship Program was less than one percent of state spending on K–12 public schools through 2022–23. Only after expansion of eligibility in 2024 did it exceed 1 percent, reaching 2.4 percent in 2024–25, which is still a very small number in comparison.
OSP funding amounts to a tiny fraction of overall public-school spending. To say that it is somehow causing irreparable budgetary pressures on public schools is severely overstating the case. It also ignores a key fact: Funding for the Opportunity Scholarship Program does not come from the public-school budget.
Funding for public schools grew faster after the Opportunity Scholarship Program began
Does the Opportunity Scholarship Program take money from the public schools and make it harder for the public schools to receive funding? Spending data from the last 20 years fail to support the charges.
Whereas per-pupil, inflation-adjusted spending in public schools declined 4.5 percent in the decade immediately before the Opportunity Scholarship Program, it has increased 9.5 percent since then, during the first decade of the program. A review of the relative growth of the OSP and K–12 public school budgets show that, while the program has grown dramatically, OSP expenditures are still just 2.4 percent the size of K–12 expenditures.
Counter to what the governor and other Opportunity Scholarship detractors keep saying, the OSP and traditional public schools are not locked in a zero-sum game where one can benefit only at the expense of the other. Both options can prosper. And that’s the best outcome for parents, students, educators and all North Carolinians.
[i] Note: OSP enrollment and funding increased dramatically in 2025–26. The reason those figures are not included in this analysis is because the comparable data from public schools are not yet available.
The post No, Opportunity Scholarships are not a “drain” on public schools appeared first on John Locke Foundation.